

Question: please answer the question above using the table below. which is between 3.2 and 3.3 3) Construct profit diagrams for a bear spread with 950
please answer the question above using the table below. which is between 3.2 and 3.3
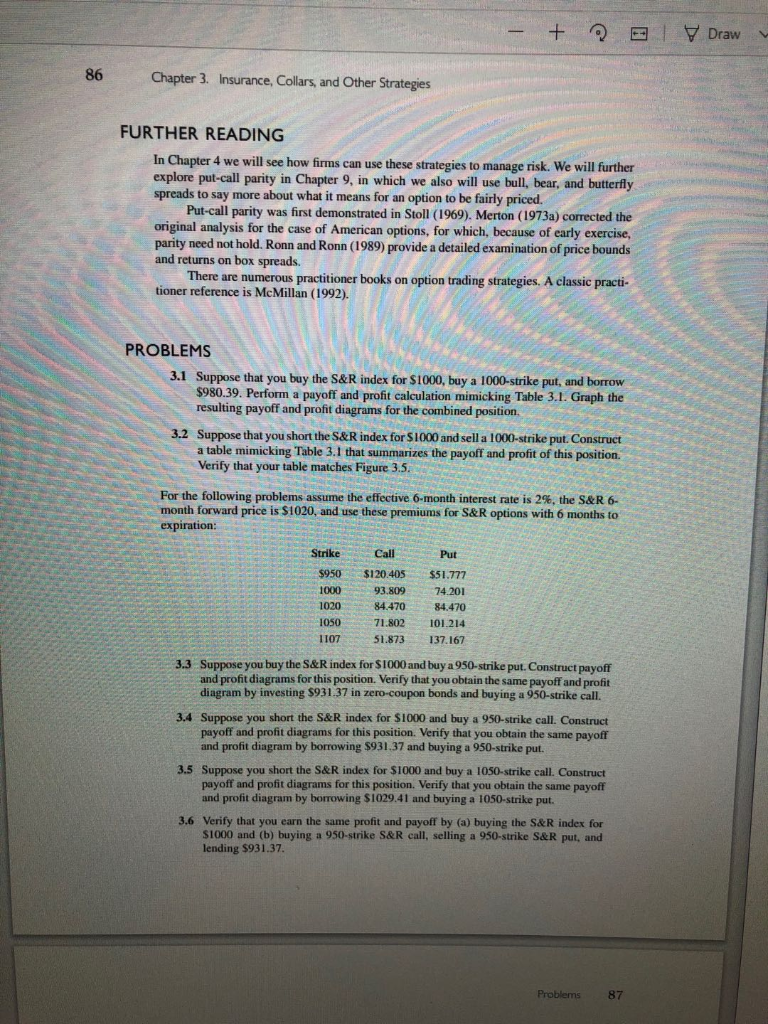
3) Construct profit diagrams for a bear spread with 950 and 1107 strikes using the table of premiums on page 86 of the textbook (Note the 6-month effective interest rate is 2%). Previous Next + Draw 86 Chapter 3. Insurance, Collars, and Other Strategies FURTHER READING In Chapter 4 we will see how firms can use these strategies to manage risk. We will further explore put-call parity in Chapter 9, in which we also will use bull, bear, and butterfly spreads to say more about what it means for an option to be fairly priced. Put-call parity was first demonstrated in Stoll (1969). Merton (1973a) corrected the original analysis for the case of American options, for which, because of early exercise, parity need not hold. Ronn and Ronn (1989) provide a detailed examination of price bounds and returns on box spreads. There are numerous practitioner books on option trading strategies. A classic practi- tioner reference is McMillan (1992). PROBLEMS 3.1 Suppose that you buy the S&R index for $1000, buy a 1000-strike put, and borrow $980.39. Perform a payoff and profit calculation mimicking Table 3.1. Graph the resulting payoff and profit diagrams for the combined position 3.2 Suppose that you short the S&R index for $1000 and sell a 1000-strike put. Construct a table mimicking Table 3.1 that summarizes the payoff and profit of this position Verify that your table matches Figure 3.5. For the following problems assume the effective 6-month interest rate is 2%, the S&R 6- month forward price is $1020, and use these premiums for S&R options with 6 months to expiration: Call Strike $950 1000 1020 1050 1107 $120.405 93.809 84.470 71.802 51.873 Put $51.777 74.201 84.470 101.214 137.167 3.3 Suppose you buy the S&R index for $1000 and buy a 950-strike put. Construct payoff and profit diagrams for this position. Verify that you obtain the same payoff and profit diagram by investing $931. 37 in zero-coupon bonds and buying a 950-strike call. 3.4 Suppose you short the S&R index for $1000 and buy a 950-strike call. Construct payoff and profit diagrams for this position. Verify that you obtain the same payoff and profit diagram by borrowing $931.37 and buying a 950-strike put. 3.5 Suppose you short the S&R index for $1000 and buy a 1050-strike call. Construct payoff and profit diagrams for this position. Verify that you obtain the same payoff and profit diagram by borrowing $1029.41 and buying a 1050-strike put. 3.6 Verify that you earn the same profit and payoff by (a) buying the S&R index for S1000 and (b) buying a 950-strike S&R call, selling a 950-strike S&R put, and lending $931.37. Problems 87 3) Construct profit diagrams for a bear spread with 950 and 1107 strikes using the table of premiums on page 86 of the textbook (Note the 6-month effective interest rate is 2%). Previous Next + Draw 86 Chapter 3. Insurance, Collars, and Other Strategies FURTHER READING In Chapter 4 we will see how firms can use these strategies to manage risk. We will further explore put-call parity in Chapter 9, in which we also will use bull, bear, and butterfly spreads to say more about what it means for an option to be fairly priced. Put-call parity was first demonstrated in Stoll (1969). Merton (1973a) corrected the original analysis for the case of American options, for which, because of early exercise, parity need not hold. Ronn and Ronn (1989) provide a detailed examination of price bounds and returns on box spreads. There are numerous practitioner books on option trading strategies. A classic practi- tioner reference is McMillan (1992). PROBLEMS 3.1 Suppose that you buy the S&R index for $1000, buy a 1000-strike put, and borrow $980.39. Perform a payoff and profit calculation mimicking Table 3.1. Graph the resulting payoff and profit diagrams for the combined position 3.2 Suppose that you short the S&R index for $1000 and sell a 1000-strike put. Construct a table mimicking Table 3.1 that summarizes the payoff and profit of this position Verify that your table matches Figure 3.5. For the following problems assume the effective 6-month interest rate is 2%, the S&R 6- month forward price is $1020, and use these premiums for S&R options with 6 months to expiration: Call Strike $950 1000 1020 1050 1107 $120.405 93.809 84.470 71.802 51.873 Put $51.777 74.201 84.470 101.214 137.167 3.3 Suppose you buy the S&R index for $1000 and buy a 950-strike put. Construct payoff and profit diagrams for this position. Verify that you obtain the same payoff and profit diagram by investing $931. 37 in zero-coupon bonds and buying a 950-strike call. 3.4 Suppose you short the S&R index for $1000 and buy a 950-strike call. Construct payoff and profit diagrams for this position. Verify that you obtain the same payoff and profit diagram by borrowing $931.37 and buying a 950-strike put. 3.5 Suppose you short the S&R index for $1000 and buy a 1050-strike call. Construct payoff and profit diagrams for this position. Verify that you obtain the same payoff and profit diagram by borrowing $1029.41 and buying a 1050-strike put. 3.6 Verify that you earn the same profit and payoff by (a) buying the S&R index for S1000 and (b) buying a 950-strike S&R call, selling a 950-strike S&R put, and lending $931.37. Problems 87
Step by Step Solution
There are 3 Steps involved in it

Get step-by-step solutions from verified subject matter experts