Question: Please answer the question according to the parts a) , b) and c). And answer them correctly This is a subject of marketing . I
Please answer the question according to the parts a) , b) and c). And answer them correctly
This is a subject of marketing .
I have a group project and in that my part is to read a part of a article and answer the a,b and c parts please help me in that . Read the parts I am providing a),b) and c) . And please answer those parts correctly .
Review the journal article using the following format:
a) Provide a summary of the article including the methodology, results, findings and conclusions of the research.
b) Discuss the implications for managers.
c) Discuss what you think of the article (value, relevance etc.), its findings and conclusions.
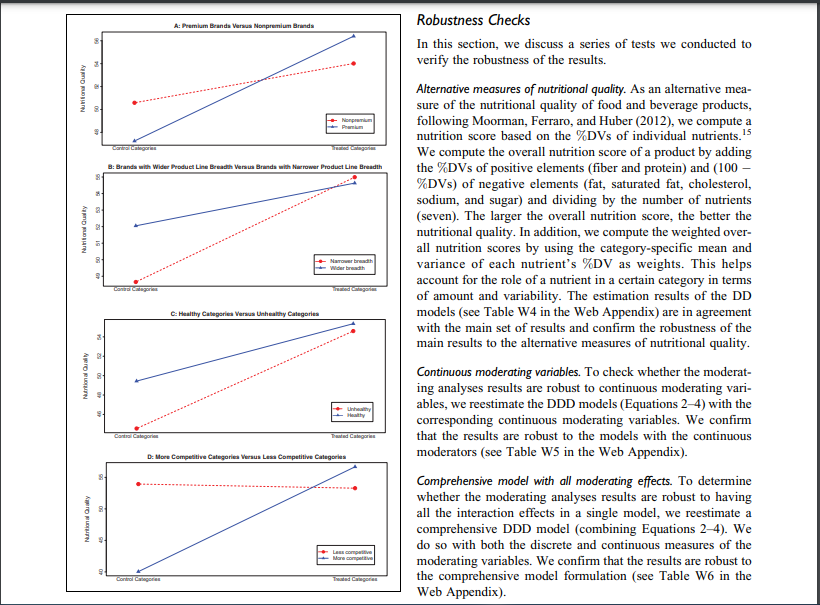
when there is to change in other putritional feontents and narrower product line breadth. We thus find support for both decreases saturated fat, sugar, and sodium by approximately H2 and H2b- .53 g, 2.3 g, and 47 45 mg, respectively. Drawing on the entire set of products in the treatmenly categories in the post-FOP Moderating Effects of Category Characteristics period, we find that FDP adoption leads to a feduction in cal- ories -12.30%), fathrated fay-12.97%), sagar (-1.62%), In H3, and H3b, we proposed that the FOP effect varies across and spdiun (-3.767; see Table 3). To evaluate the effect size categories depending on healthiness and competitive intensity. for an individual product in a fore realistic setting, we identi The results suggest that the effect of FOP introduction is fied a set pf packaged food products outside the sample. Based greater for unhealthy (vs. healthy) and for more competitive on their actual Jufritional information and serving sizes, we (vs. less competitive) categories (see Column 4 of Table 2). calculated the nafginal effect of the introduction of FOP on Figure 2 (Panels C and D) provides support for the hypotheses the nutritional quality of the selected prodpicts (see Table 3). for the category-specific moderating effects, H3a and H3b. In addition, we confirm the robustness of the DDD estimates in Equations 2, 3, and 4 to the inclusion of the interaction terms Moderating Effects of Brand Characteristics between the linear time trend and the moderators (see Table Hz. and Hz refer to the variation in the proposed effects of W2 in the Web Appendix), continuous measures of the mod- FOP labels across brands based on premium brands and prod- erating variables and a comprehensive DDD model specifica- uct line breadth. The positive and statistically significant DDD tion that includes all of the moderating variables (in both estimate (B. in Equation 2) suggests that the effect of FOP discrete and continuous forms) in a single model (for details, category adoption is stronger for premium brands (see Column see the "Robustness Checks subsection of the "Validation 2 of Table 2). In addition, the negative and statistically signif- Analyses" section). In summary, we find support for all pro- icant DDD estimate (B. in Equation 3) indicates that the FOP posed moderating effect hypotheses. effect is stronger for brands with a narrower product line breadth (see Column 3 of Table 2). The spotlight analyses Mechanism Check: The Role of Information Salience presented in Figure 2 (Panels A and B) illustrate that, following the adoption of FOP at the product category level, the differ- To test for the role of information salience as the underlying ence between the treated and control categories in nutritional mechanism that drives the effect of FOP adoption, we conduct quality is larger for premium brands and brands with a the following empirical analyses. Figure 2. Spotlight analyses for the moderating effects of the brand and category characteristics. Addressing brand mortality bias. A DD modeling approach requires the survival of the units of analysis over time to observe the change in their outcomes or behavior of interest The result suggests that the FOP effect is stronger for FOP before and after a treatment. Because the treatment occurs at adopter brands (see Table W3 in the Web Appendix). This the category level, and we are interested in how the introduc- result provides further support for our argument that salience tion of FOP affects the overall nutritional quality of all products of nutritional information is the mechanism behind the effect of at the category level, and all the categories are present before FOP adoption. and after FOP adoption, we believe that estimating the DD respectively. There is no recommended DV for sugar; however, the newly 15 Based on a 2,000 calorie diet, DVs for fat, saturated fat, cholesterol, sodium, Validation Analyses sugar, fiber, and protein are 65g, 20g, 300 mg, 2,400 mg, 50 g, 25 g, and 50 g. In this section, we present the validation analyses that we con- designed NFP includes the DV for added sugar (50 g). Because the data do ducted to confirm robustness of our results, address potential not distinguish added sugar from sugar, we use the same recommended DV for self-selection issues, test the identifying assumptions of our DD sugar. More detailed information can be accessed at http://www.fda.gov/food modeling strategy, and rule out effects due to spurious correla- December 12, 2018) and https://www.fda.gov/foodew-nutrition-facts-label/ tion and/or model misspecification. Table 5 summarizes our daily-value-new-nutrition-and-supplement-facts-labels (accessed April 5, validation analyses. ingredientspackaginglabeling/labelingnutrition/ucm274593.htm (accessed 2020). Robustness Checks A: Premium Brands Versus Nonpremium Brands In this section, we discuss a series of tests we conducted to verify the robustness of the results. Nutritional Quality Non Carina Categories B: Brands with Wider Product Line Breadth Versus Brands with Narrower Product Line Breadth KINDA 0241906 Namo bradh Widerbredih Alternative measures of nutritional quality. As an alternative mea- sure of the nutritional quality of food and beverage products, following Moorman, Ferraro, and Huber (2012), we compute a nutrition score based on the %DVs of individual nutrients. 15 We compute the overall nutrition score of a product by adding the %DVs of positive elements (fiber and protein) and (100 %DVs) of negative elements (fat, saturated fat, cholesterol, sodium, and sugar) and dividing by the number of nutrients (seven). The larger the overall nutrition score, the better the nutritional quality. In addition, we compute the weighted over- all nutrition scores by using the category-specific mean and variance of each nutrient's %DV as weights. This helps account for the role of a nutrient in a certain category in terms of amount and variability. The estimation results of the DD models (see Table W4 in the Web Appendix) are in agreement with the main set of results and confirm the robustness of the main results to the alternative measures of nutritional quality. Continuous moderating variables. To check whether the moderat- ing analyses results are robust to continuous moderating vari- ables, we reestimate the DDD models (Equations 24) with the corresponding continuous moderating variables. We confirm that the results are robust to the models with the continuous moderators (see Table W5 in the Web Appendix). Congories C.Healthy Categories Versus Unhealthy Categories ALORIN SO Unh Healthy Contoh thalai enga D: More Competitive Categories Versus Les Competitive Categories 2 Nutrition Oy Comprehensive model with all moderating effects. To determine whether the moderating analyses results are robust to having all the interaction effects in a single model, we reestimate a comprehensive DDD model (combining Equations 24). We do so with both the discrete and continuous measures of the moderating variables. We confirm that the results are robust to the comprehensive model formulation (see Table W6 in the Web Appendix) Les com Moreove Control Tagore Do firms improve nutritional quality by increasing the nutrients to nutritional information is the mechanism that drives the encourage or decreasing the nutrients to limit? Although food effect of FOP adoption. These results suggest that food products have nutrients to encourage (e.g., fiber) and nutri- manufacturers improve the nutritional quality of their prod- ents to avoid (e.g., saturated fat), as shown in Figure 1, ucts by decreasing the content of nutrients to limit. Facts Up Front-style FOP labels are required to carry four basic icons for calories, saturated fat, sodium, and sugar Do FOP adopter brands improve nutritional quality more than non- (nutrients to limit) as the default format. Given this, our FOP adopter brands? Following the adoption of FOP for the first main argument that FOP adoption leads to salience of nutri- time in a category, some brands adopted the FOP nutrition tional information on the part of consumers which in turn, labeling, and others did not. We leverage this phenomenon and spurs food manufacturers to increase the nutritional quality examine how the effect of the introduction of FOP in a category of products suggests that FOP adoption has a greater impact differs across adopter versus nonadopter brands. If our argu- on calorie content and the nutrient levels that are actually ment that increased salience of nutritional information due to displayed on the FOP labels. To empirically examine this, FOP adoption is valid, we would expect FOP adopter brands to we estimate a series of DD models of levels of calories and improve the nutritional quality of their products more than non- individual nutrients. The results in Table 4 show that FOP FOP adopter brands, because the nutritional information of the adoption leads to reductions in the calorie content and in products of the FOP adopter brands would be more noticeable sugar, sodium, and saturated fat-information displayed on to consumers. To empirically test this, we examined photo- FOP labels as the default format. However, we do not find a graphs of the product packaging thoroughly to identify brands statistically significant effect of FOP adoption on the fiber, that launched products with FOP after the first introduction of protein, and unsaturated fat levelsinformation that is not FOP in a category. Then, we estimated a model in the form of required to be displayed. From a theoretical perspective, Equation 2) to examine the variation in the effect of FOP across these results support our argument that salience of these two types of brands, FOP adopters and non-FOP adopters. models with the sample of brands that exist before and after the Addressing dominant category bias. To check whether a few domi- FOP category adoption and those that appear after the event is nant treatment categories might be driving the reported results, not a threat to validity of the results. For a similar research following Moorman, Ferraro, and Huber (2012), we compute a design, see Agrawal et al. (2018) and Bonfrer et al. (2020). jackknife pseudo-value to estimate the bias between the DD Following FOP adoption, firms may launch new brands with estimate calculated with the entire data and that calculated with better nutritional profiles or improve the nutritional profiles of the data without a specific category (Zhou, Obuchowski, and products under existing brands. Nonetheless, to establish the McClish 2002). We confirm that the DD estimate based on the robustness of the results, we estimate the main model (pre- full data falls within the 95% confidence interval around sented in Equation 1) with a sample that consists of only brands the mean of the jackknife pseudo-values which confirms that the that exist in both pre- and post-FOP adoption periods. We main result is not driven by an influential or dominant category. confirm that the main result is robust, and thus, brand mortality does not change the main results (see Table W7 in the Web Self-Selection Challenges Appendix). Categories were assigned into the treatment and control groups based on the timing of FOP adoption at the category level. We New brands versus existing brands. Given that the sample consists argued that the timing of the adoption of FOP by the first of new and existing brands, an interesting question is whether adopter brand in a category is exogenous to nutritional quality the FOP category introduction effect differs across the two of products of other brands in the category. Furthermore, we types of brands. In line with Moorman, Ferraro, and Huber's removed the first adopter brands from the treatment group (2012) argument, we expect that the FOP effect would be categories to rule out unobserved factors that are specific to stronger for new brands, because improving nutrition by first adopter brands that may not hold for the other brands that launching new brands is less likely to be risky than adjusting adopt later in the category. Inclusion of year fixed effects help the nutritional profiles of products of existing brands. To check control for the omitted variables. In addition to year fixed the potential differential effect of the introduction of FOP, we effects, we included category fixed effects in the DD models estimate a model with an interaction term between FOP and the to control for unobserved time-invariant factors that possibly indicator variable of new versus existing brands in the form of led to differences between the treatment and control categories. Equation 2. We find that the positive FOP effect is statistically The category fixed effects help absorb the category-specific stronger for new brands (see Table W8 in the Web Appendix). factors that drive nutritional quality. Despite this set of cautious


