

Question: please answer the question below. Thank you! 1. Using your previous quantitative survey, test the normality of your data. 1.1 Class Intervals 1.2 Histogram 1.3
please answer the question below. Thank you!
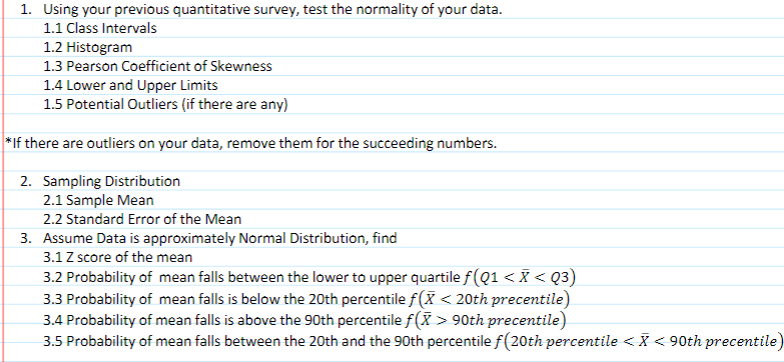
1. Using your previous quantitative survey, test the normality of your data. 1.1 Class Intervals 1.2 Histogram 1.3 Pearson Coefficient of Skewness 1.4 Lower and Upper Limits 1.5 Potential Outliers (if there are any) *If there are outliers on your data, remove them for the succeeding numbers. 2. Sampling Distribution 2.1 Sample Mean 2.2 Standard Error of the Mean 3. Assume Data is approximately Normal Distribution, find 3.1 Z score of the mean 3.2 Probability of mean falls between the lower to upper quartile f(Q1 90th precentile) 3.5 Probability of mean falls between the 20th and the 90th percentile f(20th percentile
Step by Step Solution
There are 3 Steps involved in it

Get step-by-step solutions from verified subject matter experts