Question: please answer the question from Figures 5-4 to 5-7 answer these questions 1. List and describe each decision variable 2. List and describe each of
please answer the question
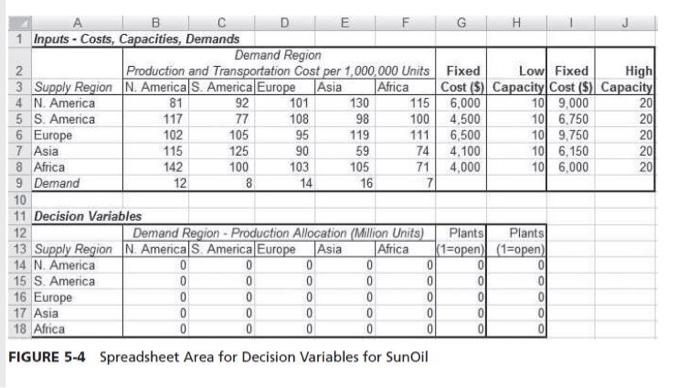
from Figures 5-4 to 5-7 answer these questions
1. List and describe each decision variable
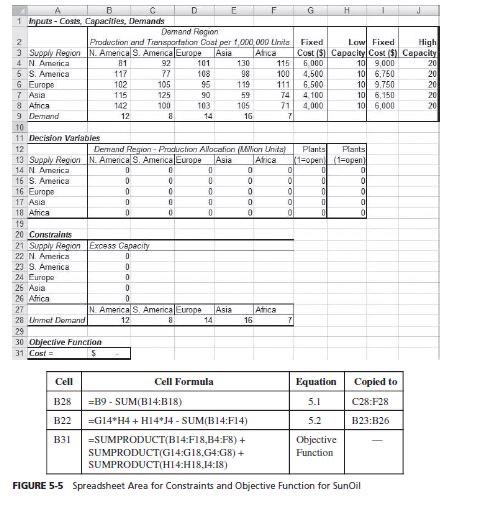
2. List and describe each of the constraints
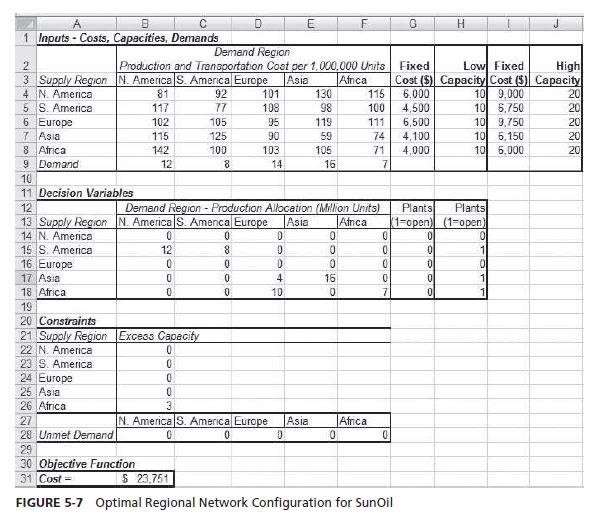
3. What is the solution? (i.e., values for each decision variable and the total costs)
4. How does the solution (decision variables and costs) change if the South American Demand Region is no longer operational (note: European demand still needs to be satisfied)?
5. Given the Scenario in question 4, where would you add capacity to reduce total costs? WHY?
E E F G H 1 Inputs - Costs, Capacities, Demands Demand Region 2 Production and Transportation Cost per 1,000,000 Units Fixed Low Fixed High 3 Supply Region N. America S. America Europe Asia Africa Cost (5) Capacity|Cost () Capacity 4 N. America 81 92 101 130 115 6,000 10 9,000 20 5 S. America 117 77 108 98 100 4,500 10 6.750 20 6 Europe 102 105 95 119 111 6,500 10 9.750 20 7 Asia 115 125 90 59 74 4.100 10 6.150 20 8 Africa 142 100 103 105 71 4,000 100 6,000 20 9 Demand 12 8 14 16 7 10 11 Decision Variables 12 Demand Region - Production Allocation (Million Units) Plants Plants 13 Supply Region N. America S. America Europe Asia Africa (1=open) (1=open) 14 N. America 0 0 0 0 0 0 0 15 S. America 0 0 0 0 0 0 0 16 Europe 0 0 0 0 0 0 17 Asia 0 0 0 0 0 0 18 Africa 0 0 0 0 0 0 0 0 0 FIGURE 5-4 Spreadsheet Area for Decision Variables for SunOil B C D E F G H 1 Inputs - Cosis. Capacities, Demands Demand Region 2 Production and Transportation Cost per 1.000.000 Linia Fixed Law Fixed High 3 Supply Region N. Amenica S. Amenca Europe Asia Anca Cost (5) Capacity Cost ($) Capacity 4 N America 81 92 101 130 115 6.000 10 9,000 20 6. S. Amenca 117 77 108 98 100 4.500 10 6,750 20 G Europe 102 105 95 119 111 6.500 10 9.750 20 7 Asia 115 125 90 59 74 4.100 10 6,150 20 8 Anca 142 100 103 105 71 4,000 10 6,000 20 9 Demand 12 8 16 7 10 11 Decision Variables 12 Dermrand Region - Production Allocation (Won Unita Plants Plants 13 Supply Region N. Amenca S. America Europe Asia Arica K1=open (1=open 14 N America 0 0 0 0 0 0 16 S. America 0 0 0 0 0 o 0 16 Europe D 0 0 0 0 0 0 D 0 0 0 0 0 18 Africa 0 0 0 0 0 0 19 20 Constraints 21 Supply Region Exc953 Capacity 22 N America D 23 S. Amenca 0 24 Europe 0 26 Asia 0 26 Africa 0 27 N. Amencas America Europe Asia Atica 28 Urmet Demand 12 8 14 16 29 30 Objective Function 31 Cost = 5 17 Agia Cell Cell Formula Equation Copied to B28 =B9 - SUM(B14:B18) 5.1 C28:F28 B22 =G14*H4 + H14*J4 - SUM(B14:F14) 5.2 B23:B26 B31 =SUMPRODUCT(B14:F18,B4:F8) + Objective SUMPRODUCT(GI 4:G18.G4:68) + Function SUMPRODUCT(H14:H18.14:18) FIGURE 5-5 Spreadsheet Area for Constraints and Objective Function for SunOil G H Fixed Low Fixed High Cost (5) Capacity Cost (9) Capacity 6.000 10 9.000 20 4,500 10 6,750 20 6,500 10 9.750 201 4,100 10 6,150 20 4.000 10 6,000 20 A E F 1 Inputs - Costs, Capacities, Demands Demand Region 2 Production and Transportation Cost per 1.000.000 Units 3 Supaly Region N. America S. America Europe Asia Africa 4 N. America 81 92 101 130 115 5 S. America 117 77 108 98 100 6 Europe 102 105 95 119 111 7 Asia 115 125 90 59 74 8 Africa 142 100 103 105 71 9 Demand 12 8 14 16 7 10 11 Decision Variables 12 Demand Region - Production Allocation (Million Units) 13 Supply Region N. America S. Amenca Europe Asia Anca 14 N. America 0 0 0 0 15 S. America 12 8 0 16 Europe 0 0 0 17 Asia 0 4 16 18 Africa 0 10 7 19 20 Constraints 21 Supply Region Excess Capacity 22 N. America 0 23 S. America 0 24 Europe 0 25 Asia 0 26 Africa 3 27 N. America S. America Europe Asia Atrca 28 Unmet Demand 0 0 0 0 29 30 Objective Function 31 Cost $ 23.751 OOO Plants Plants 1-open) (1=open 0 0 01 1 o 0 1 0 1 OO FIGURE 5-7 Optimal Regional Network Configuration for SunOil E E F G H 1 Inputs - Costs, Capacities, Demands Demand Region 2 Production and Transportation Cost per 1,000,000 Units Fixed Low Fixed High 3 Supply Region N. America S. America Europe Asia Africa Cost (5) Capacity|Cost () Capacity 4 N. America 81 92 101 130 115 6,000 10 9,000 20 5 S. America 117 77 108 98 100 4,500 10 6.750 20 6 Europe 102 105 95 119 111 6,500 10 9.750 20 7 Asia 115 125 90 59 74 4.100 10 6.150 20 8 Africa 142 100 103 105 71 4,000 100 6,000 20 9 Demand 12 8 14 16 7 10 11 Decision Variables 12 Demand Region - Production Allocation (Million Units) Plants Plants 13 Supply Region N. America S. America Europe Asia Africa (1=open) (1=open) 14 N. America 0 0 0 0 0 0 0 15 S. America 0 0 0 0 0 0 0 16 Europe 0 0 0 0 0 0 17 Asia 0 0 0 0 0 0 18 Africa 0 0 0 0 0 0 0 0 0 FIGURE 5-4 Spreadsheet Area for Decision Variables for SunOil B C D E F G H 1 Inputs - Cosis. Capacities, Demands Demand Region 2 Production and Transportation Cost per 1.000.000 Linia Fixed Law Fixed High 3 Supply Region N. Amenica S. Amenca Europe Asia Anca Cost (5) Capacity Cost ($) Capacity 4 N America 81 92 101 130 115 6.000 10 9,000 20 6. S. Amenca 117 77 108 98 100 4.500 10 6,750 20 G Europe 102 105 95 119 111 6.500 10 9.750 20 7 Asia 115 125 90 59 74 4.100 10 6,150 20 8 Anca 142 100 103 105 71 4,000 10 6,000 20 9 Demand 12 8 16 7 10 11 Decision Variables 12 Dermrand Region - Production Allocation (Won Unita Plants Plants 13 Supply Region N. Amenca S. America Europe Asia Arica K1=open (1=open 14 N America 0 0 0 0 0 0 16 S. America 0 0 0 0 0 o 0 16 Europe D 0 0 0 0 0 0 D 0 0 0 0 0 18 Africa 0 0 0 0 0 0 19 20 Constraints 21 Supply Region Exc953 Capacity 22 N America D 23 S. Amenca 0 24 Europe 0 26 Asia 0 26 Africa 0 27 N. Amencas America Europe Asia Atica 28 Urmet Demand 12 8 14 16 29 30 Objective Function 31 Cost = 5 17 Agia Cell Cell Formula Equation Copied to B28 =B9 - SUM(B14:B18) 5.1 C28:F28 B22 =G14*H4 + H14*J4 - SUM(B14:F14) 5.2 B23:B26 B31 =SUMPRODUCT(B14:F18,B4:F8) + Objective SUMPRODUCT(GI 4:G18.G4:68) + Function SUMPRODUCT(H14:H18.14:18) FIGURE 5-5 Spreadsheet Area for Constraints and Objective Function for SunOil G H Fixed Low Fixed High Cost (5) Capacity Cost (9) Capacity 6.000 10 9.000 20 4,500 10 6,750 20 6,500 10 9.750 201 4,100 10 6,150 20 4.000 10 6,000 20 A E F 1 Inputs - Costs, Capacities, Demands Demand Region 2 Production and Transportation Cost per 1.000.000 Units 3 Supaly Region N. America S. America Europe Asia Africa 4 N. America 81 92 101 130 115 5 S. America 117 77 108 98 100 6 Europe 102 105 95 119 111 7 Asia 115 125 90 59 74 8 Africa 142 100 103 105 71 9 Demand 12 8 14 16 7 10 11 Decision Variables 12 Demand Region - Production Allocation (Million Units) 13 Supply Region N. America S. Amenca Europe Asia Anca 14 N. America 0 0 0 0 15 S. America 12 8 0 16 Europe 0 0 0 17 Asia 0 4 16 18 Africa 0 10 7 19 20 Constraints 21 Supply Region Excess Capacity 22 N. America 0 23 S. America 0 24 Europe 0 25 Asia 0 26 Africa 3 27 N. America S. America Europe Asia Atrca 28 Unmet Demand 0 0 0 0 29 30 Objective Function 31 Cost $ 23.751 OOO Plants Plants 1-open) (1=open 0 0 01 1 o 0 1 0 1 OO FIGURE 5-7 Optimal Regional Network Configuration for SunOil