

Question: please answer the question i give like Analyzing inventory from Data Visualization The following data visualization depicts quarterly revenue, cost of goods sold. and sross
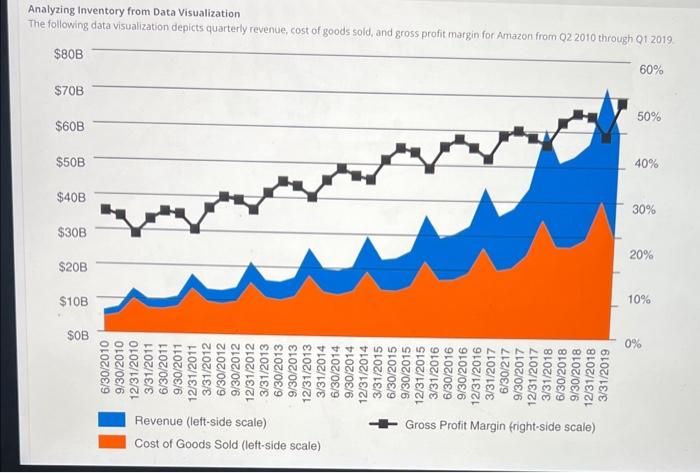
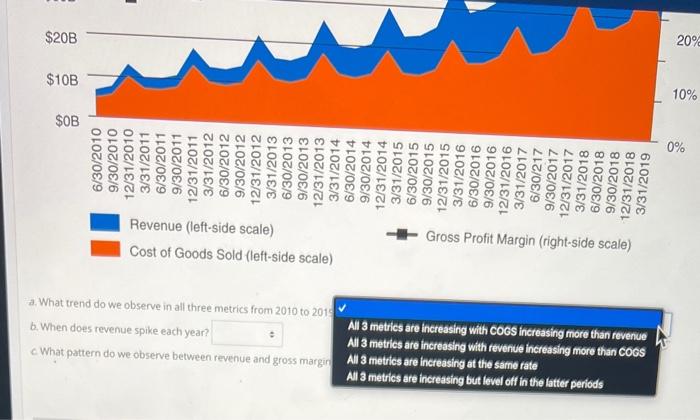
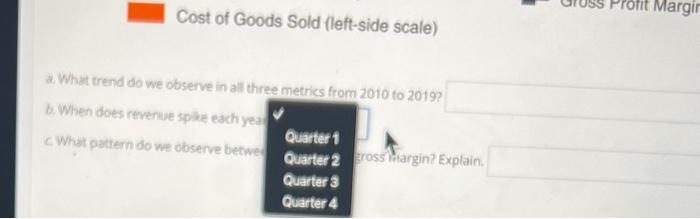
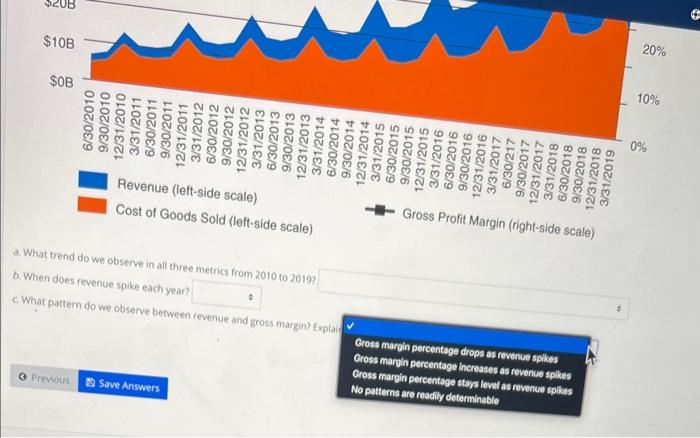
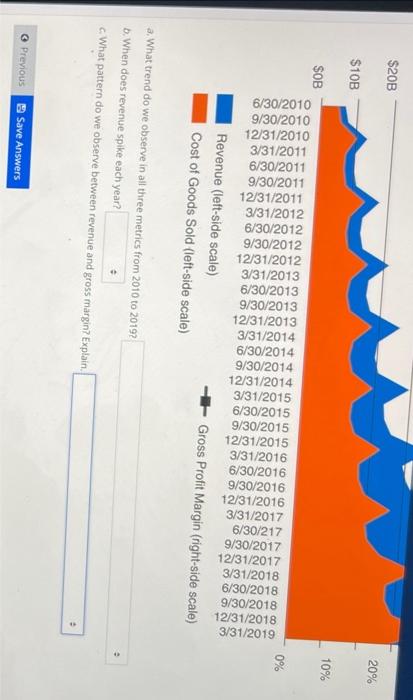
Analyzing inventory from Data Visualization The following data visualization depicts quarterly revenue, cost of goods sold. and sross nrnfit marsin fns . a. What trend do we observe in all three metrics from 2010 to 2015 b. When does revenue spike each year? All 3 metrics are increasing with coos increasing more than revenue C. What pattern do we observe between revenue and gross metrics are increasing with revenue increasing more than cocs All 3 metrics are increasing at the same rate All 3 metrics are increasing but level off in the latter periods a. What trend do we observe in all three metrics from 2010 to 2019 ? b. When does revenue spile each yea c. What pattern do we observe betwe What trend do we observe in all three metrics from 2010 to 2019? When does revenue spike each year? What pattern do we observe between revenue and gross margin? Expla a. What trend do we observe in all three metrics from 2010 to 2019? b. When does revenue spike each year? c. What pattern do we observe between revenue and gross margin? Explain
Step by Step Solution
There are 3 Steps involved in it

Get step-by-step solutions from verified subject matter experts