

Question: Please answer the question in excel with the formulas for how each answer was obtained. Thanks in advance. Home Depot, Inc. Balance Sheet All figures
Please answer the question in excel with the formulas for how each answer was obtained.
Thanks in advance.
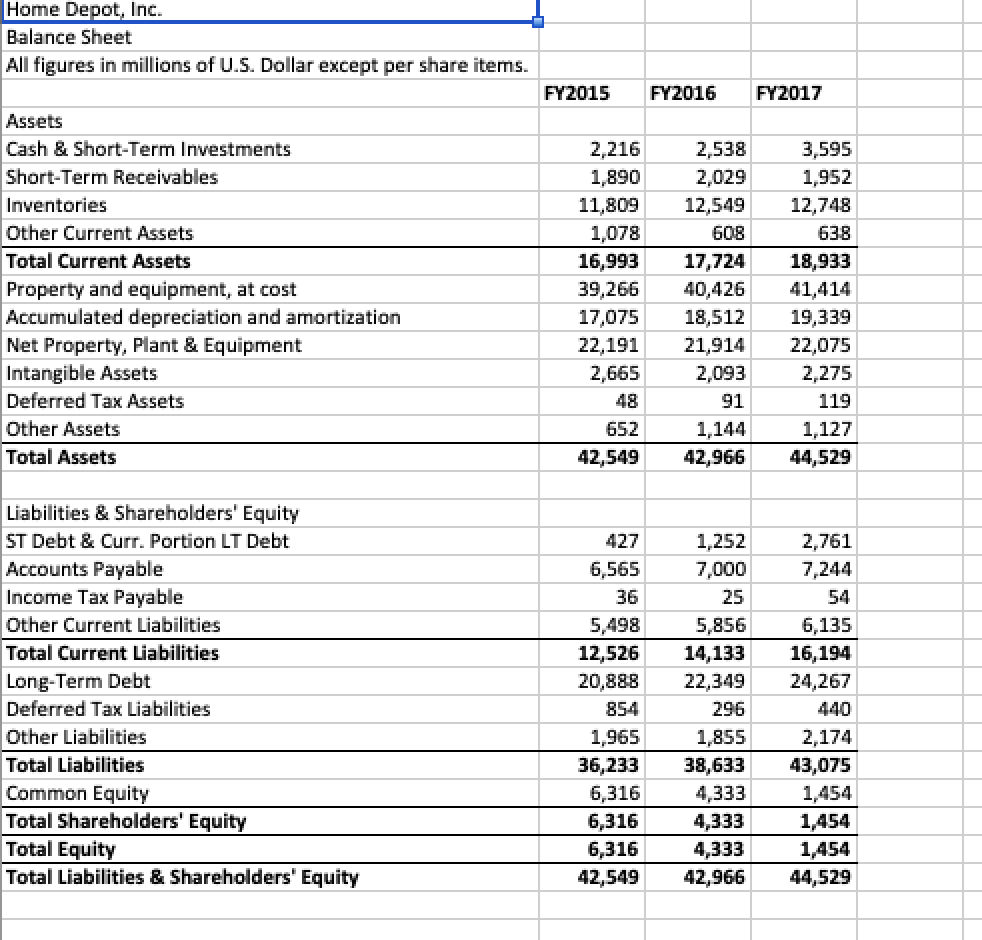
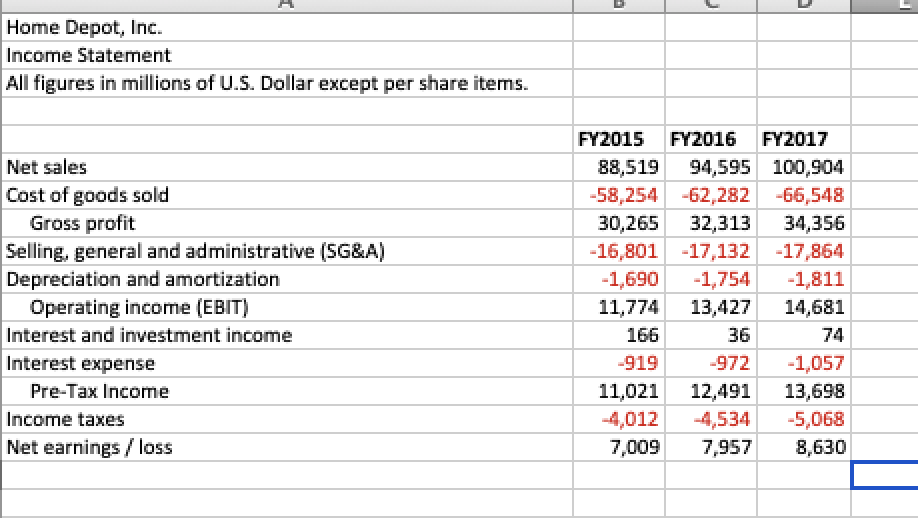
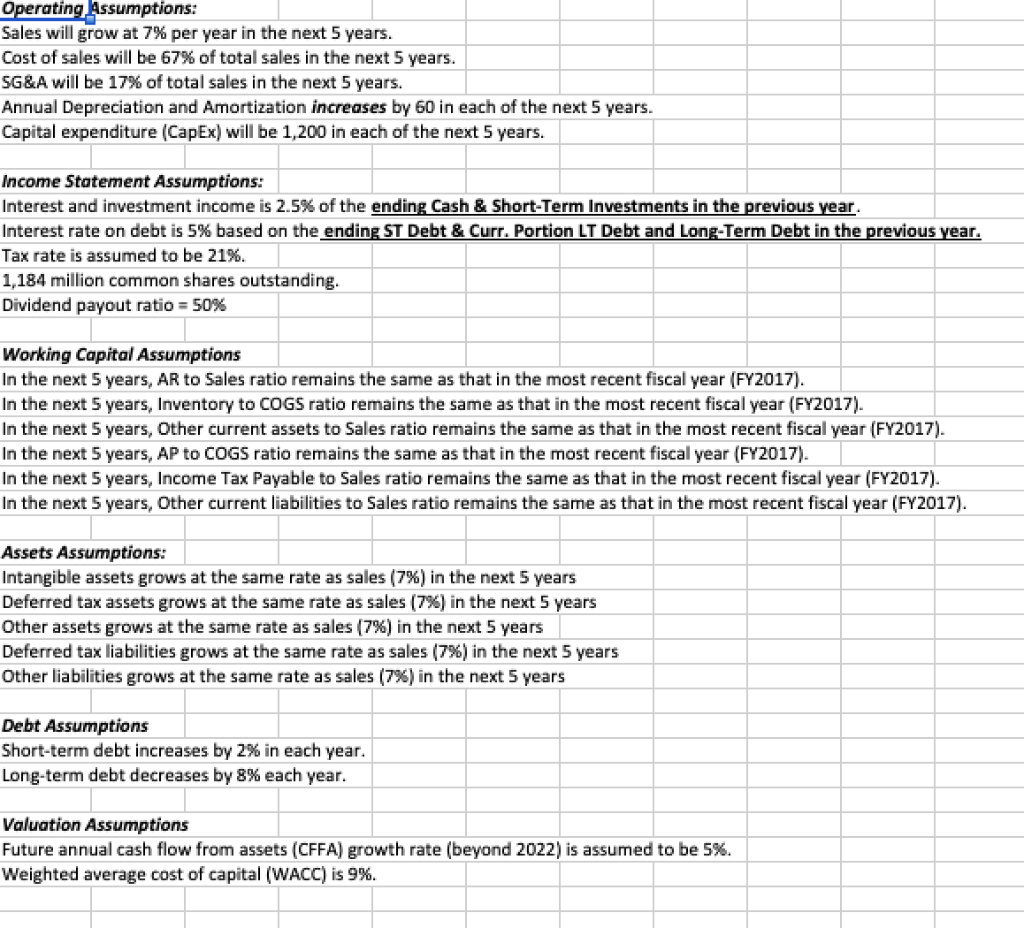
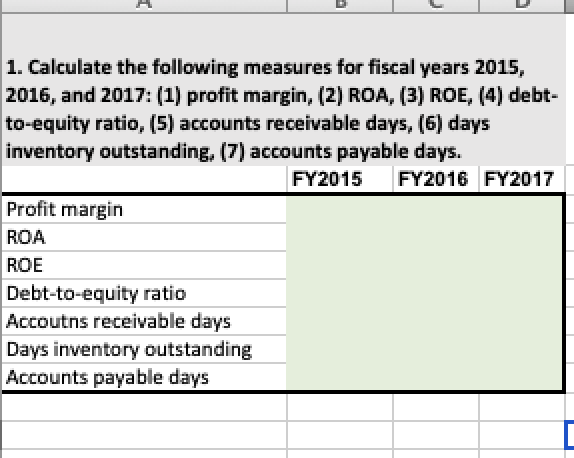
Home Depot, Inc. Balance Sheet All figures in millions of U.S. Dollar except per share items. FY2015 FY2016 FY2017 Assets Cash & Short-Term Investments Short-Term Receivables Inventories Other Current Assets Total Current Assets Property and equipment, at cost Accumulated depreciation and amortization Net Property, Plant & Equipment Intangible Assets Deferred Tax Assets Other Assets Total Assets 2,216 1,890 11,809 1,078 16,993 39,266 17,075 22,191 2,665 2,538 2,029 12,549 608 17,724 40,426 18,512 21,914 2,093 91 1,144 42,966 3,595 1,952 12,748 638 18,933 41,414 19,339 22,075 2,275 119 1,127 44,529 652 42,549 Liabilities & Shareholders' Equity ST Debt & Curr. Portion LT Debt Accounts Payable Income Tax Payable Other Current Liabilities Total Current Liabilities Long-Term Debt Deferred Tax Liabilities Other Liabilities Total Liabilities Common Equity Total Shareholders' Equity Total Equity Total Liabilities & Shareholders' Equity 427 6,565 36 5,498 12,526 20,888 854 1,965 36,233 6,316 6,316 6,316 42,549 1,252 7,000 25 5,856 14,133 22,349 296 1,855 38,633 4,333 4,333 4,333 42,966 2,761 7,244 54 6,135 16,194 24,267 440 2,174 43,075 1,454 1,454 1,454 44,529 Home Depot, Inc. Income Statement All figures in millions of U.S. Dollar except per share items. Net sales Cost of goods sold Gross profit Selling, general and administrative (SG&A) Depreciation and amortization Operating income (EBIT) Interest and investment income Interest expense Pre-Tax Income Income taxes Net earnings / loss FY2015 FY2016 FY2017 88,519 94,595 100,904 -58,254 -62,282 -66,548 30,265 32,313 34,356 -16,801 17,132 -17,864 -1,690 -1,754 -1,811 11,774 13,427 14,681 166 36 74 -919 -972 -1,057 11,021 12,491 13,698 -4,012 -4,534 -5,068 7,009 7,957 8,630 Operating Assumptions: Sales will grow at 7% per year in the next 5 years. Cost of sales will be 67% of total sales in the next 5 years. SG&A will be 17% of total sales in the next 5 years. Annual Depreciation and Amortization increases by 60 in each of the next 5 years. Capital expenditure (CapEx) will be 1,200 in each of the next 5 years. Income Statement Assumptions: Interest and investment income is 2.5% of the ending Cash & Short-Term Investments in the previous year. Interest rate on debt is 5% based on the ending ST Debt & Curr. Portion LT Debt and Long-Term Debt in the previous year. Tax rate is assumed to be 21%. 1,184 million common shares outstanding. Dividend payout ratio = 50% Working Capital Assumptions In the next 5 years, AR to Sales ratio remains the same as that in the most recent fiscal year (FY2017). In the next 5 years, Inventory to COGS ratio remains the same as that in the most recent fiscal year (FY2017). In the next 5 years, Other current assets to Sales ratio remains the same as that in the most recent fiscal year (FY2017). In the next 5 years, AP to COGS ratio remains the same as that in the most recent fiscal year (FY2017). In the next 5 years, Income Tax Payable to Sales ratio remains the same as that in the most recent fiscal year (FY2017). In the next 5 years, Other current liabilities to Sales ratio remains the same as that in the most recent fiscal year (FY2017). Assets Assumptions: Intangible assets grows at the same rate as sales (7%) in the next 5 years Deferred tax assets grows at the same rate as sales (7%) in the next 5 years Other assets grows at the same rate as sales (7%) in the next 5 years Deferred tax liabilities grows at the same rate as sales (7%) in the next 5 years Other liabilities grows at the same rate as sales (7%) in the next 5 years Debt Assumptions Short-term debt increases by 2% in each year. Long-term debt decreases by 8% each year. Valuation Assumptions Future annual cash flow from assets (CFFA) growth rate (beyond 2022) is assumed to be 5%. Weighted average cost of capital (WACC) is 9%. 1. Calculate the following measures for fiscal years 2015, 2016, and 2017: (1) profit margin, (2) ROA, (3) ROE, (4) debt- to-equity ratio, (5) accounts receivable days, (6) days inventory outstanding, (7) accounts payable days. FY2015 FY2016 FY2017 Profit margin ROA ROE Debt-to-equity ratio Accoutns receivable days Days inventory outstanding Accounts payable days Home Depot, Inc. Balance Sheet All figures in millions of U.S. Dollar except per share items. FY2015 FY2016 FY2017 Assets Cash & Short-Term Investments Short-Term Receivables Inventories Other Current Assets Total Current Assets Property and equipment, at cost Accumulated depreciation and amortization Net Property, Plant & Equipment Intangible Assets Deferred Tax Assets Other Assets Total Assets 2,216 1,890 11,809 1,078 16,993 39,266 17,075 22,191 2,665 2,538 2,029 12,549 608 17,724 40,426 18,512 21,914 2,093 91 1,144 42,966 3,595 1,952 12,748 638 18,933 41,414 19,339 22,075 2,275 119 1,127 44,529 652 42,549 Liabilities & Shareholders' Equity ST Debt & Curr. Portion LT Debt Accounts Payable Income Tax Payable Other Current Liabilities Total Current Liabilities Long-Term Debt Deferred Tax Liabilities Other Liabilities Total Liabilities Common Equity Total Shareholders' Equity Total Equity Total Liabilities & Shareholders' Equity 427 6,565 36 5,498 12,526 20,888 854 1,965 36,233 6,316 6,316 6,316 42,549 1,252 7,000 25 5,856 14,133 22,349 296 1,855 38,633 4,333 4,333 4,333 42,966 2,761 7,244 54 6,135 16,194 24,267 440 2,174 43,075 1,454 1,454 1,454 44,529 Home Depot, Inc. Income Statement All figures in millions of U.S. Dollar except per share items. Net sales Cost of goods sold Gross profit Selling, general and administrative (SG&A) Depreciation and amortization Operating income (EBIT) Interest and investment income Interest expense Pre-Tax Income Income taxes Net earnings / loss FY2015 FY2016 FY2017 88,519 94,595 100,904 -58,254 -62,282 -66,548 30,265 32,313 34,356 -16,801 17,132 -17,864 -1,690 -1,754 -1,811 11,774 13,427 14,681 166 36 74 -919 -972 -1,057 11,021 12,491 13,698 -4,012 -4,534 -5,068 7,009 7,957 8,630 Operating Assumptions: Sales will grow at 7% per year in the next 5 years. Cost of sales will be 67% of total sales in the next 5 years. SG&A will be 17% of total sales in the next 5 years. Annual Depreciation and Amortization increases by 60 in each of the next 5 years. Capital expenditure (CapEx) will be 1,200 in each of the next 5 years. Income Statement Assumptions: Interest and investment income is 2.5% of the ending Cash & Short-Term Investments in the previous year. Interest rate on debt is 5% based on the ending ST Debt & Curr. Portion LT Debt and Long-Term Debt in the previous year. Tax rate is assumed to be 21%. 1,184 million common shares outstanding. Dividend payout ratio = 50% Working Capital Assumptions In the next 5 years, AR to Sales ratio remains the same as that in the most recent fiscal year (FY2017). In the next 5 years, Inventory to COGS ratio remains the same as that in the most recent fiscal year (FY2017). In the next 5 years, Other current assets to Sales ratio remains the same as that in the most recent fiscal year (FY2017). In the next 5 years, AP to COGS ratio remains the same as that in the most recent fiscal year (FY2017). In the next 5 years, Income Tax Payable to Sales ratio remains the same as that in the most recent fiscal year (FY2017). In the next 5 years, Other current liabilities to Sales ratio remains the same as that in the most recent fiscal year (FY2017). Assets Assumptions: Intangible assets grows at the same rate as sales (7%) in the next 5 years Deferred tax assets grows at the same rate as sales (7%) in the next 5 years Other assets grows at the same rate as sales (7%) in the next 5 years Deferred tax liabilities grows at the same rate as sales (7%) in the next 5 years Other liabilities grows at the same rate as sales (7%) in the next 5 years Debt Assumptions Short-term debt increases by 2% in each year. Long-term debt decreases by 8% each year. Valuation Assumptions Future annual cash flow from assets (CFFA) growth rate (beyond 2022) is assumed to be 5%. Weighted average cost of capital (WACC) is 9%. 1. Calculate the following measures for fiscal years 2015, 2016, and 2017: (1) profit margin, (2) ROA, (3) ROE, (4) debt- to-equity ratio, (5) accounts receivable days, (6) days inventory outstanding, (7) accounts payable days. FY2015 FY2016 FY2017 Profit margin ROA ROE Debt-to-equity ratio Accoutns receivable days Days inventory outstanding Accounts payable days
Step by Step Solution
There are 3 Steps involved in it

Get step-by-step solutions from verified subject matter experts