

Question: Please answer the question in imagine or make an excel table and screenshot for me. thank u sososo much Sir Capital Structure Ratios 2019 2020
 Please answer the question in imagine or make an excel table and screenshot for me. thank u sososo much Sir
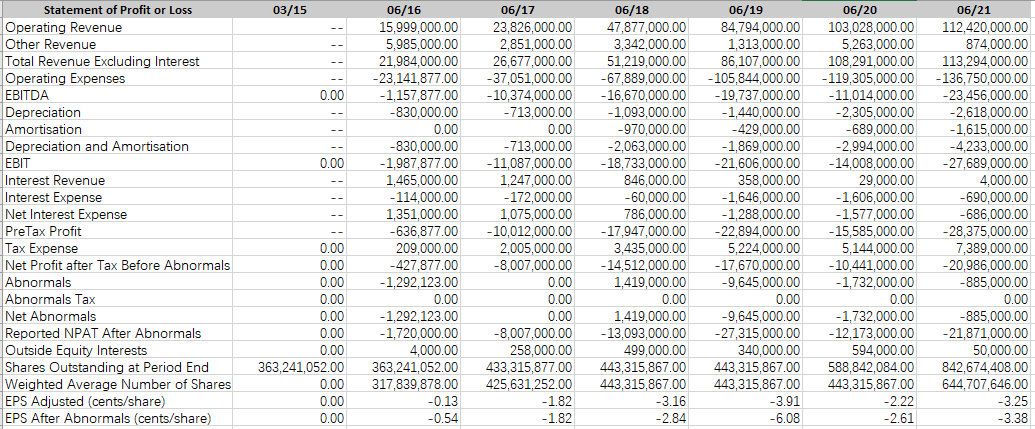
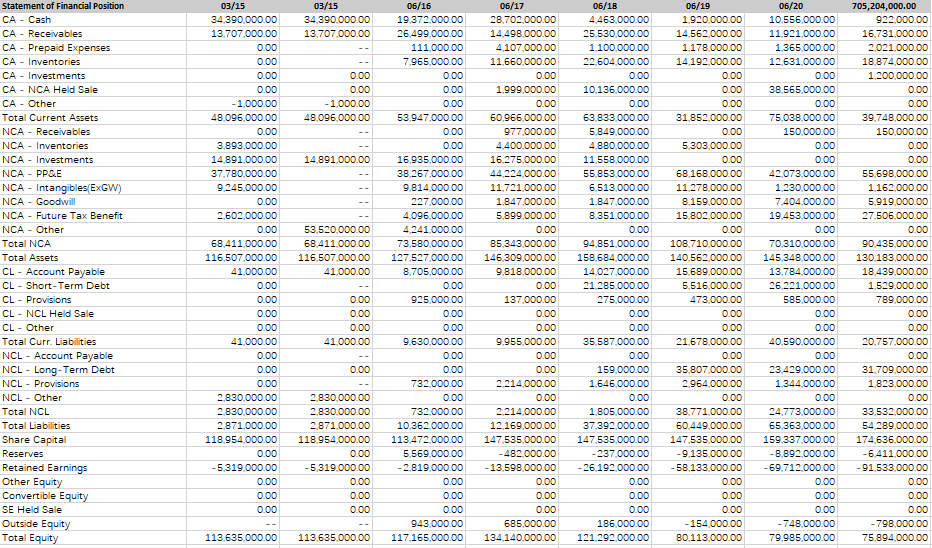
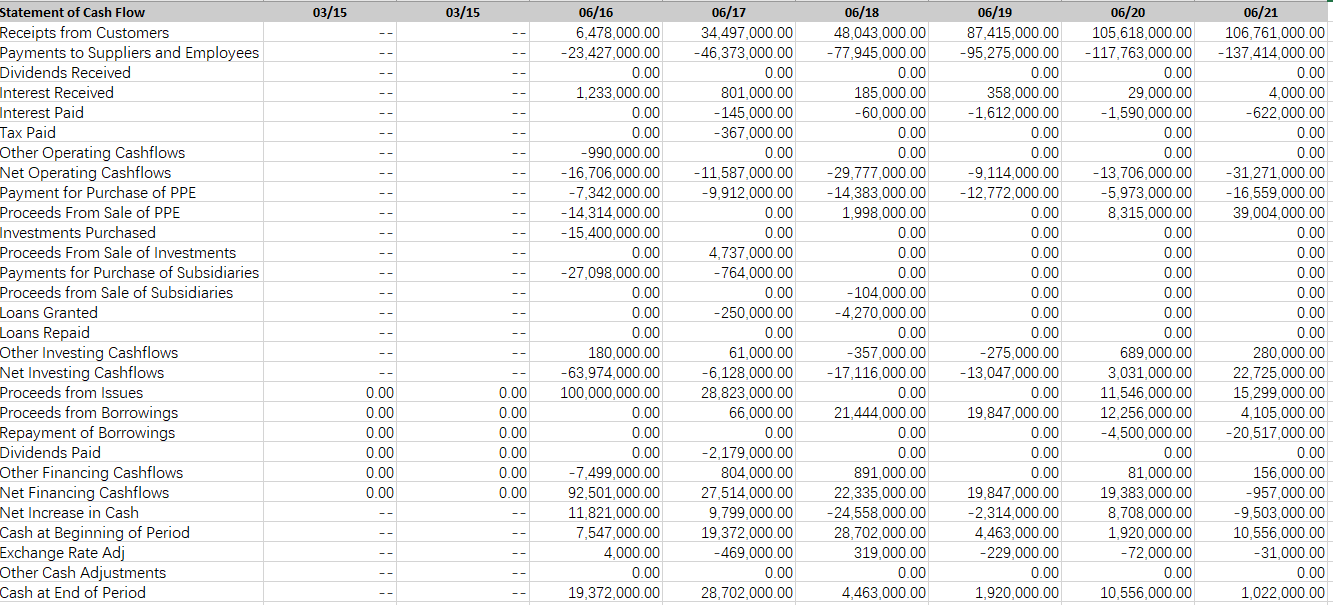
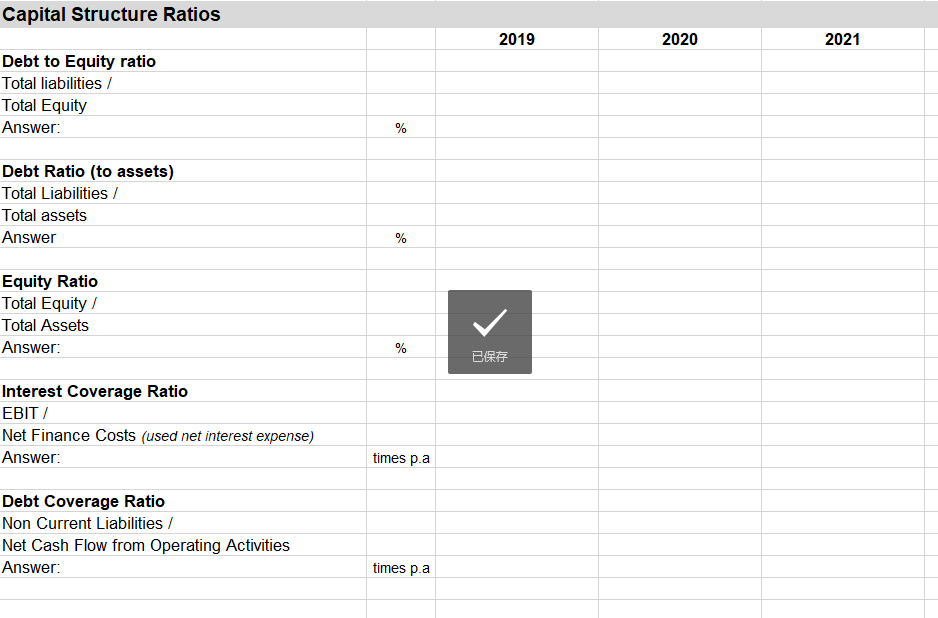
Capital Structure Ratios 2019 2020 2021 Debt to Equity ratio Total liabilities/ Total Equity Answer: % Debt Ratio (to assets) Total Liabilities/ Total assets Answer % Equity Ratio Total Equity / Total Assets Answer: % Interest Coverage Ratio EBIT/ Net Finance Costs (used net interest expense) Answer: times p.a Debt Coverage Ratio Non Current Liabilities/ Net Cash Flow from Operating Activities Answer: times p.a 03/15 ' 0.00 0.00 Statement of Profit or Loss Operating Revenue Other Revenue Total Revenue Excluding Interest Operating Expenses EBITDA Depreciation Amortisation Depreciation and Amortisation EBIT Interest Revenue Interest Expense Net Interest Expense PreTax Profit Tax Expense Net Profit after Tax Before Abnormals Abnormals Abnormals Tax Net Abnormals Reported NPAT After Abnormals Outside Equity Interests Shares Outstanding at Period End Weighted Average Number of Shares EPS Adjusted (cents/share) EPS After Abnormals (cents/share) 06/16 15,999,000.00 5,985,000.00 21,984,000.00 -23,141,877.00 -1,157,877.00 -830,000.00 0.00 -830,000.00 -1,987,877.00 1,465,000.00 - 114,000.00 1,351,000.00 -636,877.00 209,000.00 -427,877.00 -1,292, 123.00 0.00 -1,292, 123.00 -1,720,000.00 4,000.00 363,241,052.00 317,839,878.00 -0.13 -0.54 06/17 23,826,000.00 2,851,000.00 26,677,000.00 -37,051,000.00 -10,374,000.00 -713,000.00 0.00 -713,000.00 -11,087,000.00 1.247,000.00 -172,000.00 1,075,000.00 - 10,012,000.00 2,005,000.00 -8,007,000.00 0.00 0.00 0.00 -8,007,000.00 258,000.00 433,315,877.00 425,631,252.00 -1.82 -1.82 06/18 47,877,000.00 3,342,000.00 51,219,000.00 -67,889,000.00 -16,670,000.00 -1,093,000.00 -970,000.00 -2,063,000.00 -18,733,000.00 846,000.00 -60,000.00 786,000.00 -17,947,000.00 3,435,000.00 -14,512,000.00 1,419,000.00 0.00 1,419,000.00 -13,093,000.00 499,000.00 443,315,867.00 443,315,867.00 -3.16 -2.84 06/19 84,794,000.00 1,313,000.00 86,107,000.00 -105,844,000.00 - 19,737,000.00 -1,440,000.00 -429,000.00 -1,869,000.00 -21,606,000.00 358,000.00 -1,646,000.00 -1,288,000.00 -22,894,000.00 5,224,000.00 -17,670,000.00 -9,645,000.00 0.00 -9,645,000.00 -27,315,000.00 340,000.00 443,315,867.00 443,315,867.00 -3.91 -6.08 06/20 103,028,000.00 5,263,000.00 108,291,000.00 - 119,305,000.00 -11,014,000.00 -2,305,000.00 -689,000.00 -2.994,000.00 -14,008,000.00 29,000.00 -1,606,000.00 -1,577,000.00 - 15,585,000.00 5,144,000.00 -10,441,000.00 -1,732,000.00 0.00 -1,732,000.00 -12,173,000.00 594,000.00 588,842,084.00 443,315,867.00 06/21 112.420.000.00 874,000.00 113,294,000.00 -136,750,000.00 -23,456,000.00 -2,618,000.00 -1,615,000.00 -4,233,000.00 -27,689,000.00 4,000.00 -690,000.00 -686,000.00 -28,375,000.00 7,389,000.00 -20,986,000.00 -885,000.00 0.00 -885,000.00 -21,871,000.00 50,000.00 842,674.408.00 644,707,646.00 -3.25 -3.38 0.00 0.00 0.00 0.00 0.00 0.00 0.00 363,241,052.00 0.00 0.00 0.00 -2.22 -2.61 03/15 34 390,000.00 13.707,000.00 8: 0.00 0.00 - 1.000.00 48,096,000.00 14.891.000.00 Statement of Financial Position CA - Cash CA - Receivables CA - Prepaid Expenses CA - Inventories CA - Investments CA - NCA Held Sale CA - Other Total Current Assets NCA - Receivables NCA - Inventories NCA - Investments NCA - PPSE NCA - Intangibles(EXGW) NCA - Goodwill NCA - Future Tax Benefit NCA - Other Total NCA Total Assets CL - Account Payable CL - Short-Term Debt CL - Provisions CL - NCL Held Sale CL - Other Total Curr. Liabilities NCL - Account Payable NCL - Long-Term Debt NCL - Provisions NCL - Other Total NCL Total Liabilities Share Capital Reserves Retained Earnings Other Equity Convertible Equity SE Held Sale Outside Equity Total Equity 03/15 34 390,000.00 13.707.000.00 0.00 0.00 0.00 0.00 - 1,000.00 48,096,000.00 0.00 3.893,000.00 14.891.000.00 37.780.000.00 9.245.000.00 0.00 2.602,000.00 0.00 68.411,000.00 116.507.000.00 41.000.00 0.00 0.00 0.00 0.00 41.000.00 0.00 0.00 0.00 2.830,000.00 2.830,000.00 2.871,000.00 118.954.000.00 0.00 -5.319.000.00 0.00 0.00 0.00 53,520,000.00 68,411,000.00 116,507.000.00 41,000.00 06/16 19.372.000.00 26.499,000.00 111,000.00 7.965,000.00 0.00 0.00 0.00 53.947.000.00 0.00 0.00 16.935.000.00 38.267.000.00 9.814,000.00 227.000.00 4,096,000.00 4.241,000.00 73.580.000.00 127.527.000.00 8.705.000.00 0.00 925,000.00 0.00 0.00 9.630,000.00 0.00 0.00 732.000.00 0.00 732.000.00 10.362,000.00 113.472.000.00 5.569.000.00 -2.819,000.00 0.00 0.00 0.00 943.000.00 117.165,000.00 06/17 28.702.000.00 14.498,000.00 4 107.000.00 11,660,000.00 0.00 1.999,000.00 0.00 60.966.000.00 977,000.00 4.400,000.00 16.275.000.00 44 224.000.00 11.721.000.00 1.847,000.00 5.899,000.00 0.00 85.343,000.00 146,309,000.00 9.818,000.00 0.00 137.000.00 0.00 0.00 9.955,000.00 0.00 0.00 2.214,000.00 0.00 2.214,000.00 12.169,000.00 147.535.000.00 -482.000.00 - 13,598,000.00 0.00 0.00 0.00 685,000.00 134 140,000.00 06/18 4.463.000.00 25.530.000.00 1.100.000.00 22.604.000.00 0.00 10.136.000.00 0.00 63.833,000.00 5.849,000.00 4.880,000.00 11.558,000.00 55.853.000.00 6.513,000.00 1.847,000.00 8.351.000.00 0.00 94.851.000.00 158.684.000.00 14.027,000.00 21.285.000.00 275,000.00 0.00 0.00 35.587.000.00 0.00 159.000.00 1.646,000.00 0.00 1.805.000.00 37.392.000.00 147,535,000.00 - 237,000.00 -26.192.000.00 0.00 0.00 0.00 186.000.00 121.292.000.00 06/19 1.920,000.00 14.562,000.00 1.178,000.00 14 192.000.00 0.00 0.00 0.00 31.852,000.00 0.00 5.303,000.00 0.00 68.168.000.00 11.278,000.00 8.159,000.00 15.802.000.00 0.00 108.710.000.00 140.562,000.00 15,689,000.00 5,516,000.00 473,000.00 0.00 0.00 21,678,000.00 0.00 35.807.000.00 2.964,000.00 0.00 38.771,000.00 60.449,000.00 147.535,000.00 -9.135.000.00 -58.133.000.00 0.00 0.00 0.00 - 154.000.00 80.113,000.00 06/20 10.556.000.00 11.921,000.00 1.365.000.00 12.631,000.00 0.00 38.565.000.00 0.00 75.038.000.00 150,000.00 0.00 0.00 42.073.000.00 1.230,000.00 7.404,000.00 19.453.000.00 0.00 70.310.000.00 145,348,000.00 13.784.000.00 26,221,000.00 585,000.00 0.00 0.00 40.590,000.00 0.00 23.429,000.00 1.344.000.00 0.00 24.773.000.00 65.363.000.00 159.337.000.00 -8.892.000.00 -69.712,000.00 0.00 0.00 0.00 -748,000.00 79.985,000.00 705,204,000.00 922.000.00 16.731.000.00 2.021,000.00 18.874,000.00 1.200,000.00 0.00 0.00 39.748,000.00 150,000.00 0.00 0.00 55,698,000.00 1.162,000.00 5.919.000.00 27.506,000.00 0.00 90.435,000.00 130.183.000.00 18.439,000.00 1.529,000.00 789.000.00 0.00 0.00 20.757,000.00 0.00 31.709,000.00 1.823,000.00 0.00 33,532,000.00 54.289.000.00 174.636,000.00 -6.411.000.00 91.533,000.00 0.00 0.00 0.00 - 798,000.00 75.894,000.00 0.00 0.00 0.00 41.000.00 0.00 2.830.000.00 2.830,000.00 2.871,000.00 118.954.000.00 0.00 -5,319,000.00 0.00 0.00 0.00 113.635.000.00 113.635.000.00 03/15 03/15 Statement of Cash Flow Receipts from Customers Payments to Suppliers and Employees Dividends Received Interest Received Interest Paid Tax Paid Other Operating Cashflows Net Operating Cashflows Payment for Purchase of PPE Proceeds From Sale of PPE Investments Purchased Proceeds From Sale of Investments Payments for Purchase of Subsidiaries Proceeds from Sale of Subsidiaries Loans Granted Loans Repaid Other Investing Cashflows Net Investing Cashflows Proceeds from Issues Proceeds from Borrowings Repayment of Borrowings Dividends Paid Other Financing Cashflows Net Financing Cashflows Net Increase in Cash Cash at Beginning of Period Exchange Rate Adj Other Cash Adjustments Cash at End of Period 06/16 6,478,000.00 -23,427,000.00 0.00 1,233,000.00 0.00 0.00 -990,000.00 - 16,706,000.00 -7,342,000.00 -14, 314,000.00 -15,400,000.00 0.00 -27,098,000.00 0.00 0.00 0.00 180,000.00 -63,974,000.00 100,000,000.00 0.00 06/17 34,497,000.00 -46,373,000.00 0.00 801,000.00 -145,000.00 -367,000.00 0.00 -11,587,000.00 -9,912,000.00 0.00 0.00 4,737,000.00 -764,000.00 0.00 -250,000.00 0.00 61,000.00 -6.128,000.00 28,823,000.00 66,000.00 0.00 -2,179,000.00 804,000.00 27,514,000.00 9,799,000.00 19,372,000.00 -469,000.00 0.00 28,702,000.00 06/18 48,043,000.00 - 77,945,000.00 0.00 185,000.00 -60,000.00 0.00 0.00 -29,777,000.00 -14,383,000.00 1,998,000.00 0.00 0.00 0.00 -104,000.00 -4,270,000.00 0.00 -357,000.00 -17,116,000.00 0.00 21,444,000.00 0.00 0.00 891,000.00 22,335,000.00 -24,558,000.00 28,702,000.00 319,000.00 0.00 4,463,000.00 06/19 87,415,000.00 -95,275,000.00 0.00 358,000.00 -1,612,000.00 0.00 0.00 -9.114,000.00 -12,772,000.00 0.00 0.00 0.00 0.00 0.00 0.00 0.00 -275,000.00 -13,047,000.00 0.00 19,847,000.00 0.00 0.00 0.00 19,847,000.00 -2,314,000.00 4,463,000.00 -229,000.00 0.00 1,920,000.00 06/20 105,618,000.00 -117,763,000.00 0.00 29,000.00 -1,590,000.00 0.00 0.00 -13.706.000.00 -5,973,000.00 8,315,000.00 0.00 0.00 0.00 0.00 0.00 0.00 689,000.00 3,031,000.00 11,546,000.00 12,256,000.00 -4,500,000.00 0.00 81,000.00 19,383,000.00 8,708,000.00 1,920,000.00 -72,000.00 0.00 10,556,000.00 06/21 106,761,000.00 - 137,414,000.00 0.00 4.000.00 -622,000.00 0.00 0.00 -31,271,000.00 -16,559,000.00 39,004,000.00 0.00 0.00 0.00 0.00 0.00 0.00 280,000.00 22,725,000.00 15,299,000.00 4,105,000.00 -20,517,000.00 0.00 156,000.00 -957,000.00 -9,503,000.00 10,556,000.00 -31,000.00 0.00 1,022,000.00 -- 0.00 0.00 0.00 0.00 0.00 0.00 0.00 0.00 0.00 0.00 0.00 0.00 0.00 0.00 -7,499,000.00 92,501,000.00 11,821,000.00 7,547,000.00 4,000.00 0.00 19,372,000.00
Step by Step Solution
There are 3 Steps involved in it

Get step-by-step solutions from verified subject matter experts