

Question: please answer the question Make a Box-and-Whisker plot displaying the following data. Make sure explicitly state what 91 , Q2, and Q3 and to show
please answer the question

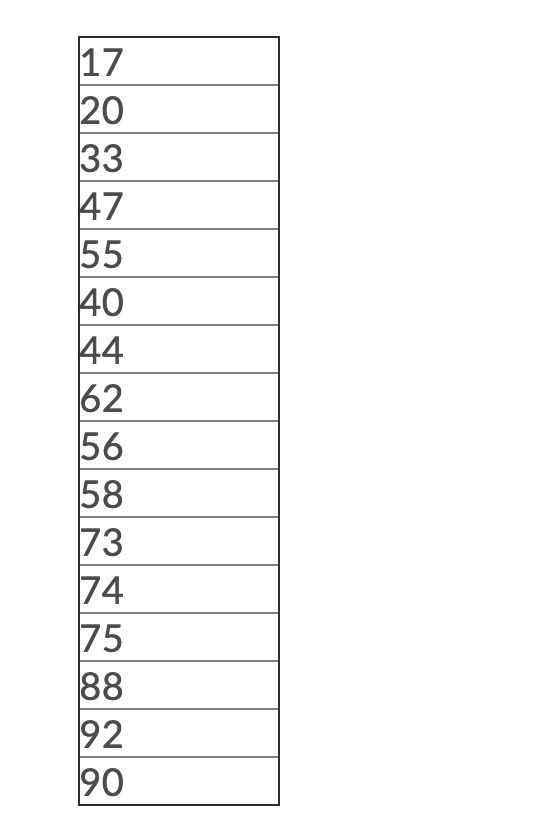
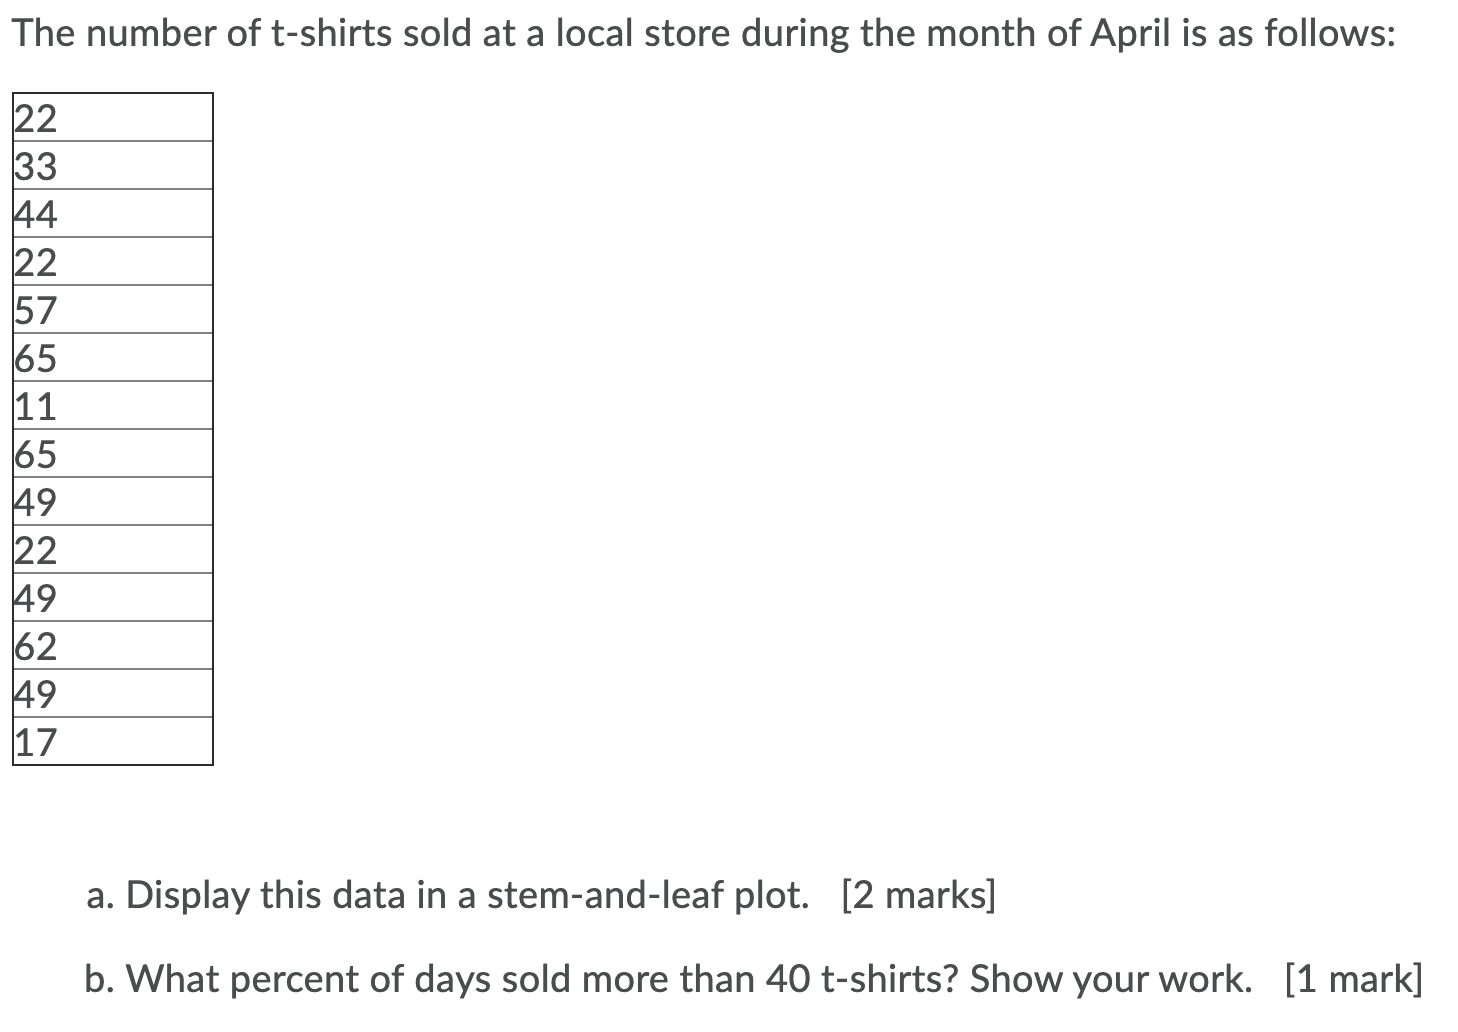
Make a Box-and-Whisker plot displaying the following data. Make sure explicitly state what 91 , Q2, and Q3 and to show your work of how you found them. Make sure that your scale is drawn with a ruler and is accurate (ie. the spacing between values on your scale should be even/equal). 17 20 33 47 55 40 44 62 56 58 73 74 75 88 92 90The number of t-shirts sold at a local store during the month of April is as follows: a. Display this data in a stem-and-leaf plot. [2 marks] b. What percent of days sold more than 40 t-shirts? Show your work. [1 mark]
Step by Step Solution
There are 3 Steps involved in it
1 Expert Approved Answer
Step: 1 Unlock

Question Has Been Solved by an Expert!
Get step-by-step solutions from verified subject matter experts
Step: 2 Unlock
Step: 3 Unlock