

Question: Please answer the question oxt 8.1.1. The table shows the regression output of Googal's excess return on S&P500 the period April 2019-March 2022. Coefficients Standard
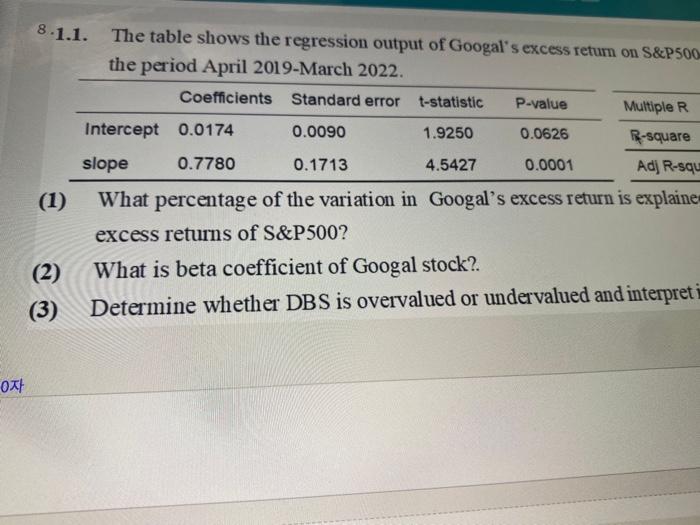
oxt 8.1.1. The table shows the regression output of Googal's excess return on S&P500 the period April 2019-March 2022. Coefficients Standard error t-statistic P-value Multiple R Intercept 0.0174 0.0090 1.9250 0.0626 R-square slope 0.7780 0.1713 4.5427 0.0001 Adj R-squ (1) What percentage of the variation in Googal's excess return is explaine excess returns of S&P500? (2) What is beta coefficient of Googal stock? (3) Determine whether DBS is overvalued or undervalued and interpret i oxt 8.1.1. The table shows the regression output of Googal's excess return on S&P500 the period April 2019-March 2022. Coefficients Standard error t-statistic P-value Multiple R Intercept 0.0174 0.0090 1.9250 0.0626 R-square slope 0.7780 0.1713 4.5427 0.0001 Adj R-squ (1) What percentage of the variation in Googal's excess return is explaine excess returns of S&P500? (2) What is beta coefficient of Googal stock? (3) Determine whether DBS is overvalued or undervalued and interpret
Step by Step Solution
There are 3 Steps involved in it

Get step-by-step solutions from verified subject matter experts