

Question: Please answer the question (Picture below) . (22 points) Given the following frequency table data, Frequency table Class Class fi Boundaries 5.5-10.5 10.5-15.5 15.5-20.5 HADJON
Please answer the question (Picture below)
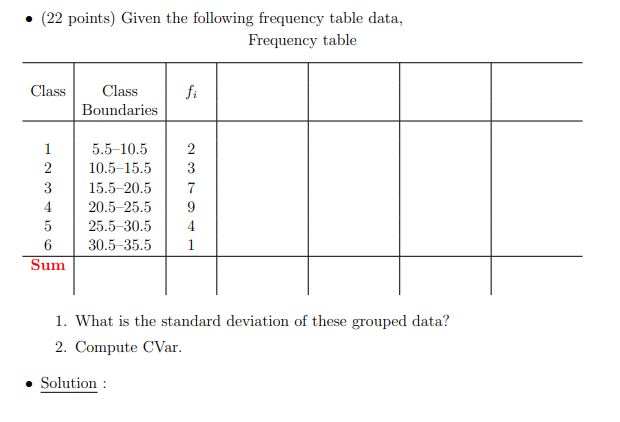
. (22 points) Given the following frequency table data, Frequency table Class Class fi Boundaries 5.5-10.5 10.5-15.5 15.5-20.5 HADJON 20.5-25.5 25.5-30.5 30.5-35.5 Sum 1. What is the standard deviation of these grouped data? 2. Compute CVar. . Solution
Step by Step Solution
There are 3 Steps involved in it
1 Expert Approved Answer
Step: 1 Unlock

Question Has Been Solved by an Expert!
Get step-by-step solutions from verified subject matter experts
Step: 2 Unlock
Step: 3 Unlock