

Question: Please answer the question provided. This is the entire question provided by the professor and I have added a screenshot of the spreadsheet referred to
Please answer the question provided. This is the entire question provided by the professor and I have added a screenshot of the spreadsheet referred to in the quesion.
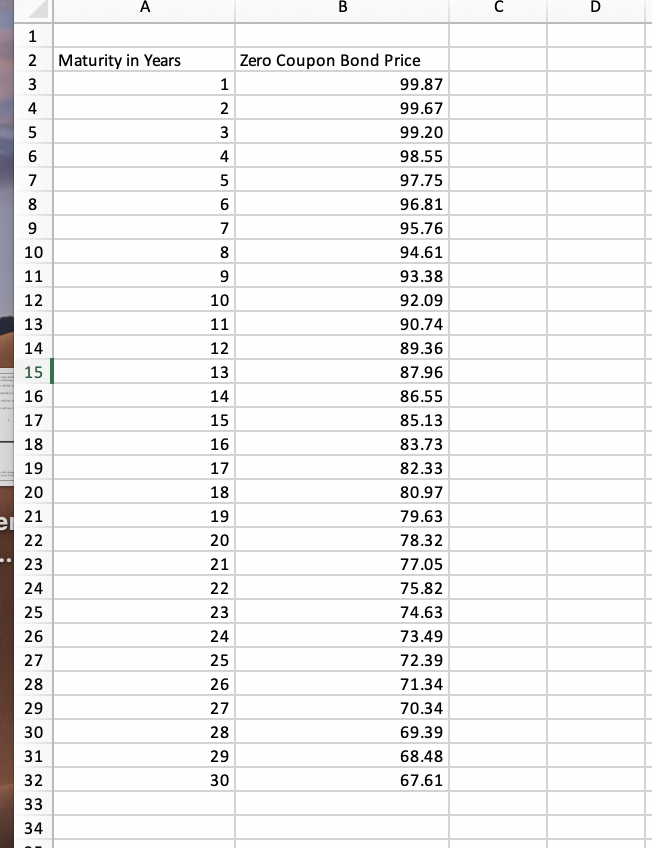
5. The spreadsheet \"Assignment4_data.xls\" provides prices for zero coupon bonds with maturities from 1 year to 30 years. The prices are for bonds of face values of $100 and were taken from the market on November 2, 2020. Calculate the implied yields to maturity for all of bonds. Also calculate the oneyear forward rates: f(2),f(3), . . . , f(30). On a sin gle gure plot the yields to maturity and forward rates as functions of maturity. Your gure should be formatted like the gure on page 36 of the slides \"Fixed Income Markets.\" (a) Discuss the shapes of the curves. What explains the relationship between the two curves? (b) What could the curves be telling us about the market's View of future interest rates? A B C D WN DO J OU A W NH Maturity in Years Zero Coupon Bond Price 99.87 99.67 3 99.20 4 98.55 5 97.75 96.81 95.76 8 94.61 9 93.38 10 92.09 11 90.74 14 12 89.36 15 13 87.96 16 14 86.55 17 15 85.13 18 16 83.73 19 17 82.33 20 18 80.97 21 19 79.63 22 20 78.32 23 21 77.05 24 22 75.82 25 23 74.63 26 24 73.49 27 25 72.39 28 26 71.34 29 27 70.34 30 28 69.39 31 29 68.48 32 30 67.61 33 34
Step by Step Solution
There are 3 Steps involved in it

Get step-by-step solutions from verified subject matter experts