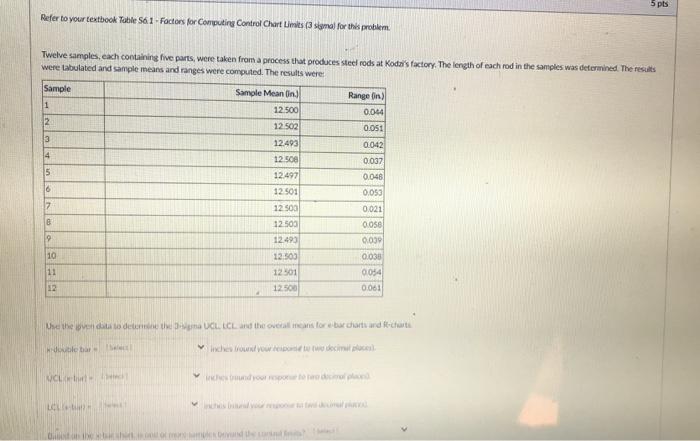
Question: please answer the questions and do not give formulas 1 12.500 0.044 0.051 2 12.502 3 12.493 0.042 0.037 4 12.508 15 12.497 0.048 16

please answer the questions and do not give formulas
please answer the questions and do not give
1 12.500 0.044 0.051 2 12.502 3 12.493 0.042 0.037 4 12.508 15 12.497 0.048 16 12.501 0.053 7 0.021 B 12.503 12.503 12.493 0.058 0.039 9 10 12503 0.038 11 0.054 12.501 22.508 12 0.061 Use the given data to determine the 3-sigma UCLLCL, and the overall means for x-bar charts and R-charts. x-double Select Inches cround your response to two decimal places) UCL Lebar Set Inches round your response to two decimal places) LCL Stea Inches fround your response to two decimal places) Dided on the star chart is one or more samples yond the controls barele che tround your rewors to two decimal places) UCLARIS inches bound response to the emplaces LCL Inches fround your response to two decimal place and on the beyond the control 5 pts Refer to your textbook Table S61 - Factors for Computing Control Chart Limits (sigmal for this problem Twelve samples, each containing five parts, were taken from a process that produces steel rods at Koda's factory. The length of each rod in the samples was determined. The results were tabulated and sample means and ranges were computed. The results were Sample Sample Meanin) Range in) 1 12.500 0.044 2 12.502 0.051 3 12.493 0042 4 12 500 0.037 5 12.497 0.046 16 12 501 0.053 7 12.500 0.021 8 12.500 0.056 9 12493 0.03 10 12,503 0.038 11 12501 0054 12 12.500 0.061 Use the end to death UCLLCL and the overall means for burdharts and carta ble bar in de VI World LU

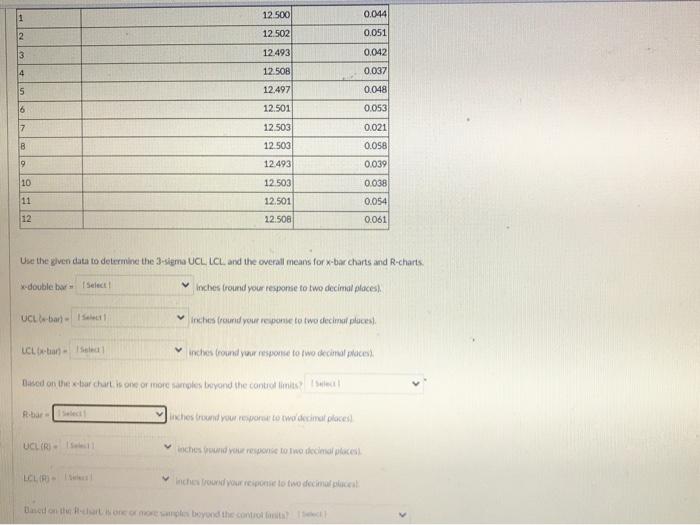
Step by Step Solution

There are 3 Steps involved in it

1 Expert Approved Answer
Step: 1 Unlock blur-text-image
Question Has Been Solved by an Expert!

Get step-by-step solutions from verified subject matter experts

Step: 2 Unlock
Step: 3 Unlock

Students Have Also Explored These Related General Management Questions!