

Question: please answer the questions below --->>>ALL FINANCIAL AND REFERENCE DOCUMENTS ARE ATTACHED IN THE PHOTOS ATTACHED. Olive Garden, Longhorn Steakhouse, Yard House, the Capital Grille,
please answer the questions below
--->>>ALL FINANCIAL AND REFERENCE DOCUMENTS ARE ATTACHED IN THE PHOTOS ATTACHED.
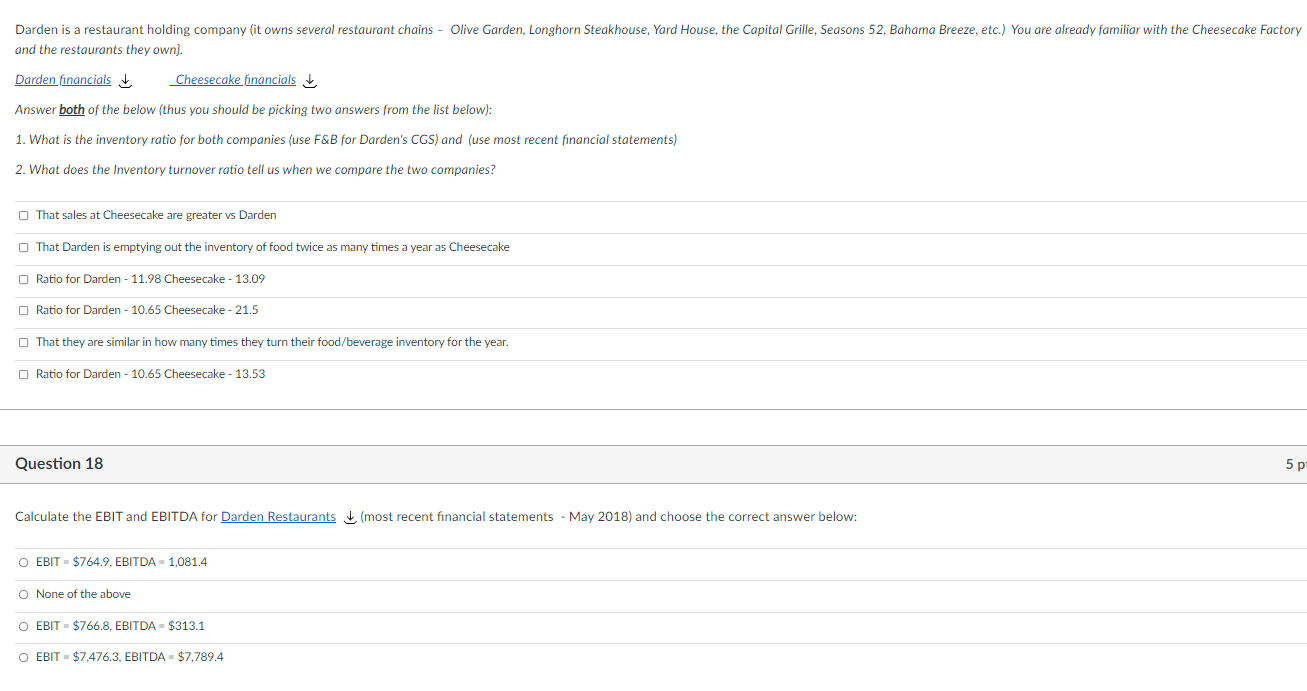
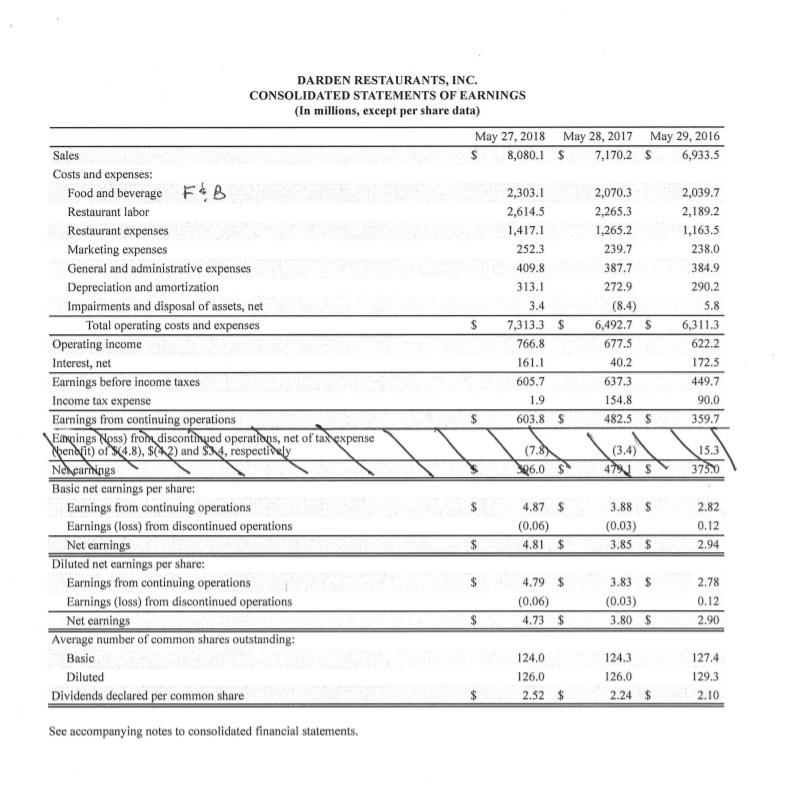
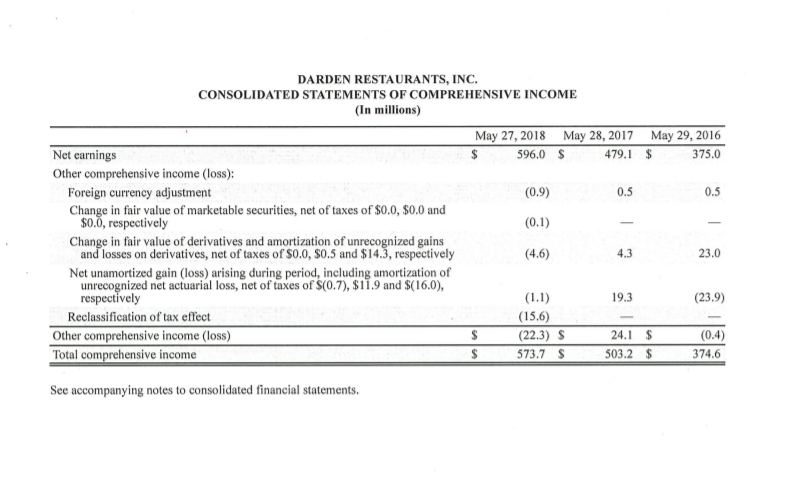
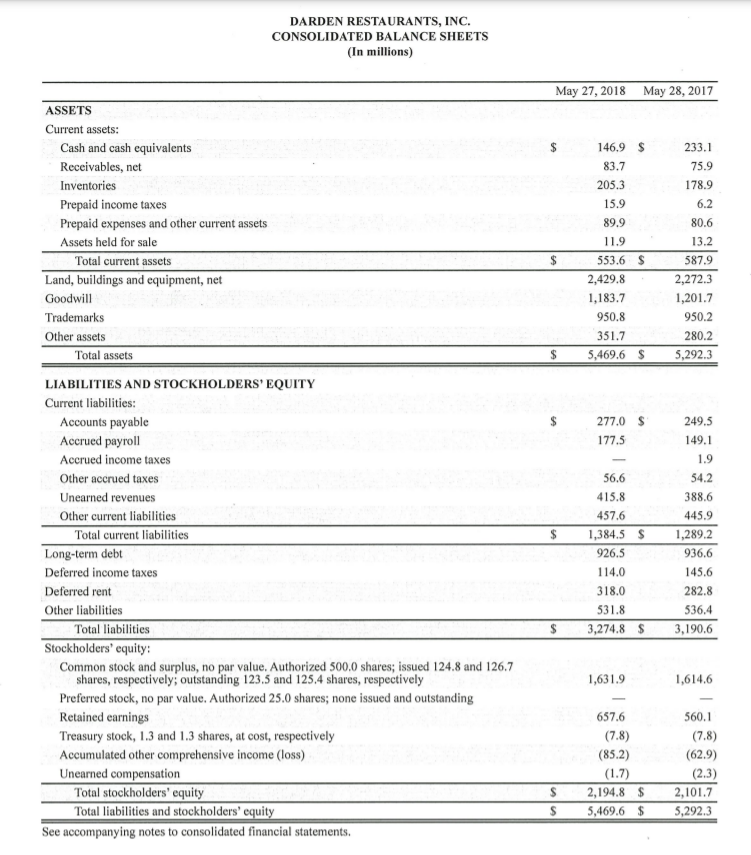
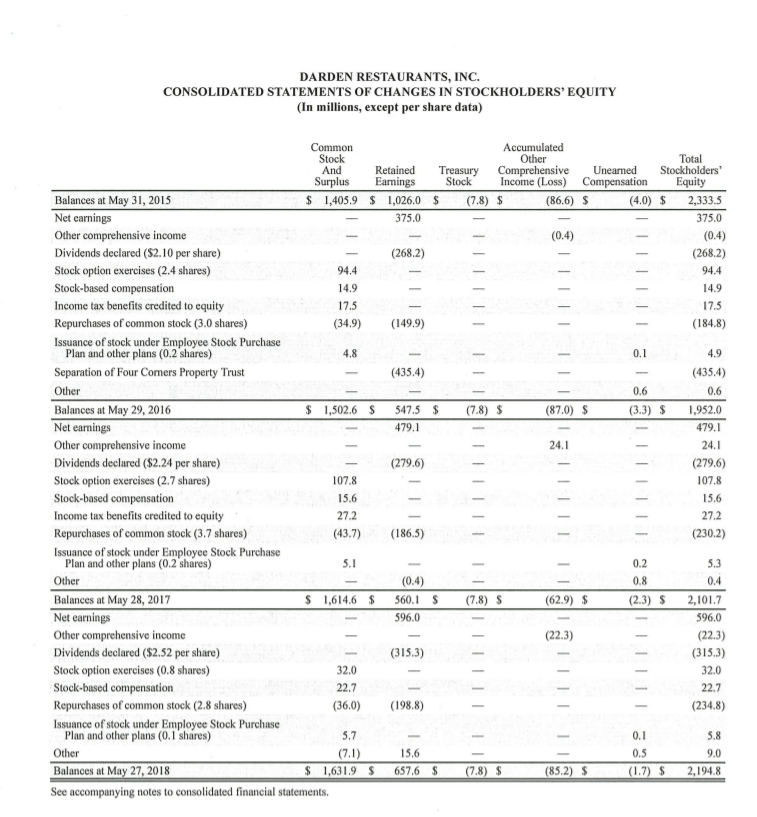
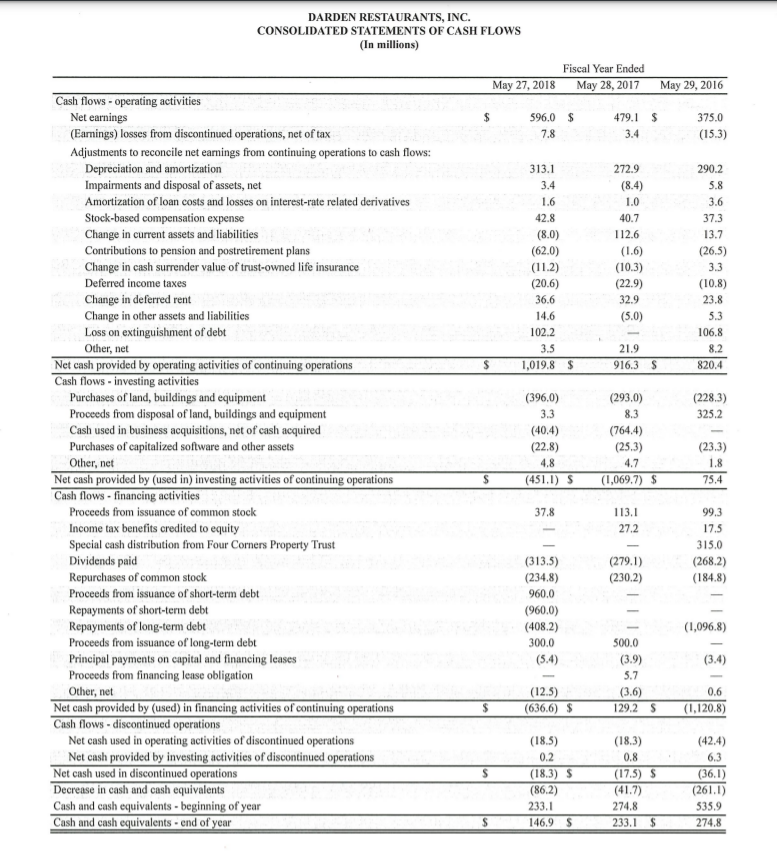
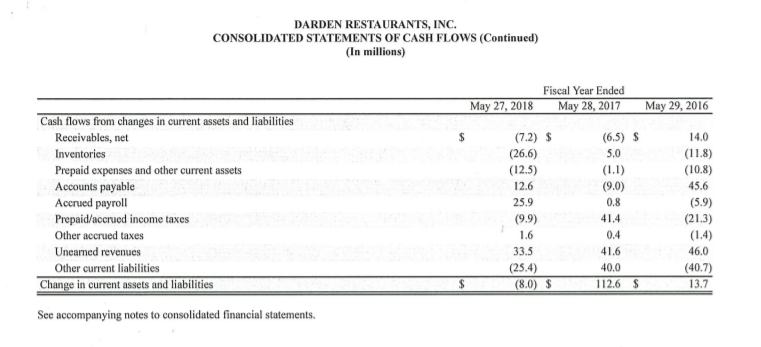
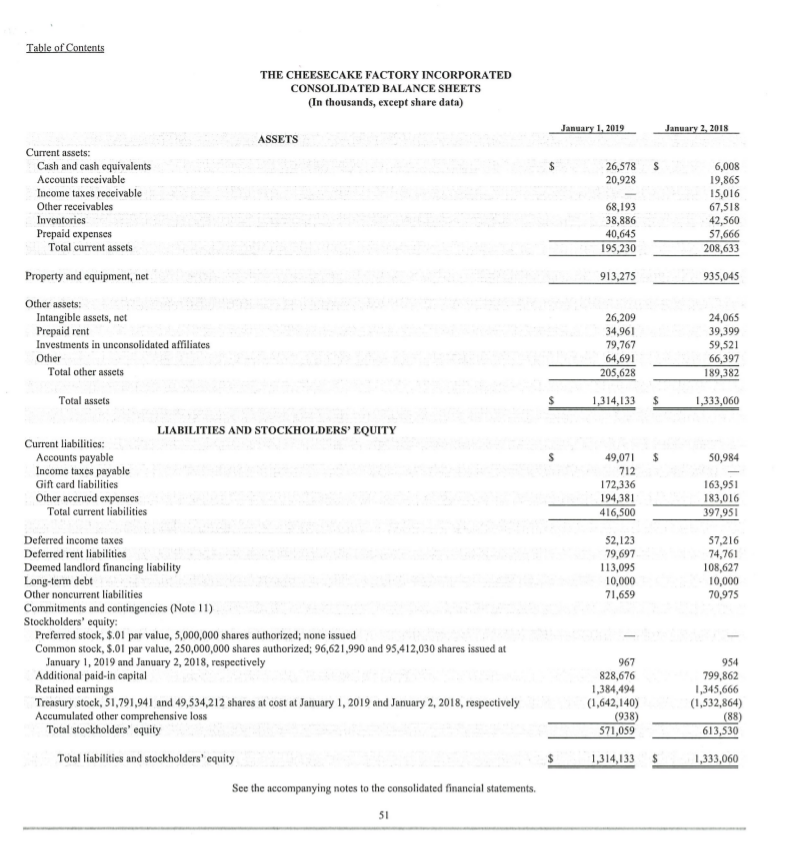
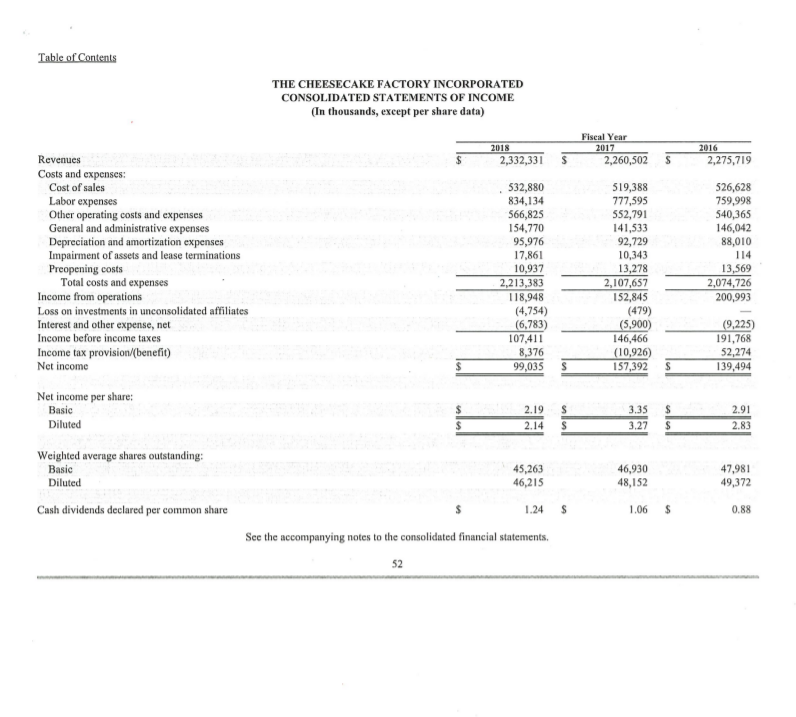
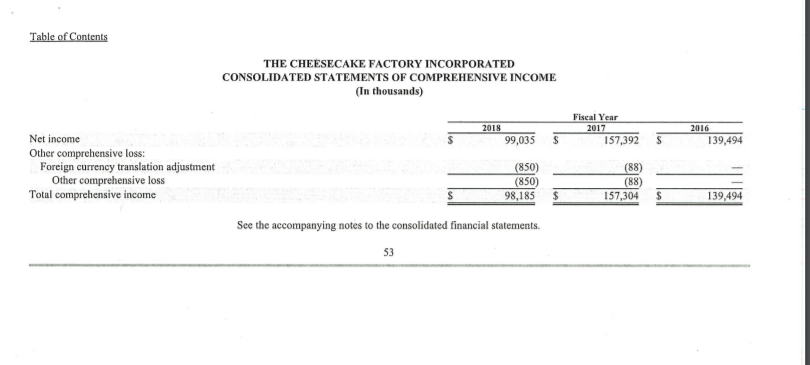
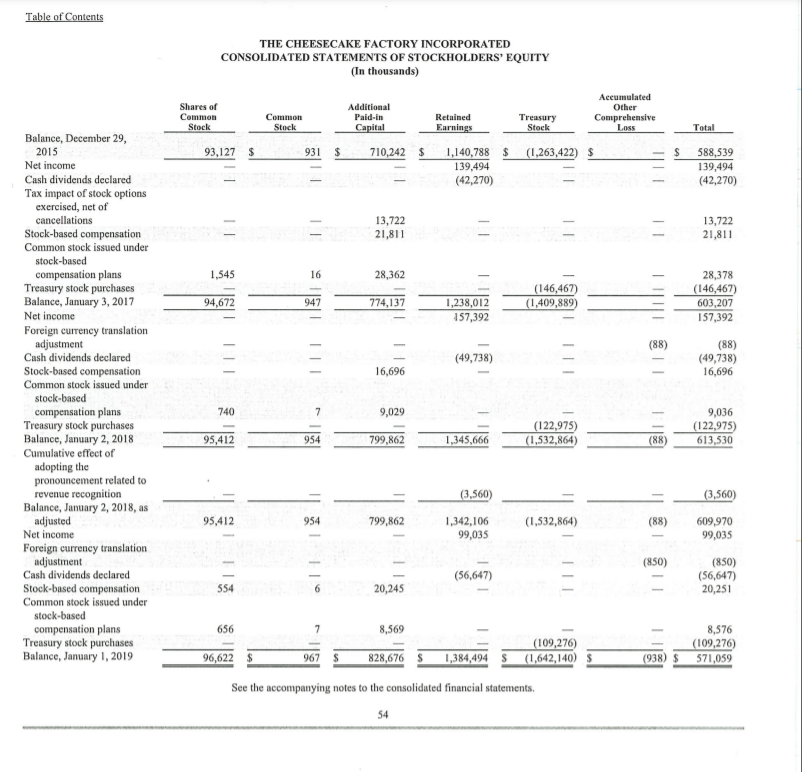
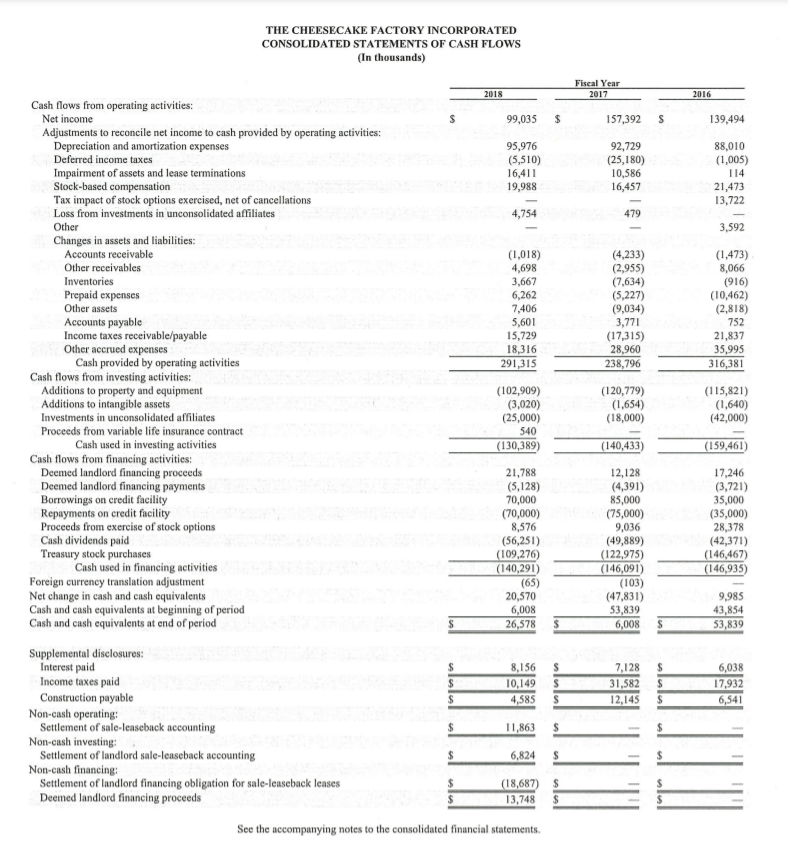
Olive Garden, Longhorn Steakhouse, Yard House, the Capital Grille, Seasons 52, Bahama Breeze, etc.) You are already familiar with the Cheesecake Factory Darden is a restaurant holding company (it owns several restaurant chains and the restaurants they own). Darden financials Cheesecake financials Answer both of the below (thus you should be picking two answers from the list below): 1. What is the inventory ratio for both companies (use F&B for Darden's CGS) and (use most recent financial statements) 2. What does the Inventory turnover ratio tell us when we compare the two companies? That sales at Cheesecake are greater vs Darden That Darden is emptying out the inventory of food twice as many times a year as Cheesecake Ratio for Darden - 11.98 Cheesecake - 13.09 Ratio for Darden - 10.65 Cheesecake - 21.5 That they are similar in how many times they turn their food/beverage inventory for the year. Ratio for Darden - 10.65 Cheesecake - 13.53 Question 18 5 p Calculate the EBIT and EBITDA for Darden Restaurants (most recent financial statements - May 2018) and choose the correct answer below: O EBIT - $764.9. EBITDA - 1,081.4 O None of the above O EBIT - $766.8. EBITDA - $313.1 O EBIT - $7,476.3, EBITDA - $7,789.4 Sales DARDEN RESTAURANTS, INC. CONSOLIDATED STATEMENTS OF EARNINGS (In millions, except per share data) May 27, 2018 May 28, 2017 May 29, 2016 $ 8,080.1 $ 7,170.2 $ 6,933.5 Costs and expenses: Food and beverage F.B 2,303.1 2,070.3 2,039.7 Restaurant labor 2,614.5 2,265.3 2,189.2 Restaurant expenses 1,417.1 1,265.2 1,163.5 Marketing expenses 252.3 239.7 238.0 General and administrative expenses 409.8 387.7 384.9 Depreciation and amortization 313.1 272.9 290.2 Impairments and disposal of assets, net 3.4 (8.4) 5.8 Total operating costs and expenses $ 7,313.3 $ 6,492.7 $ 6,311.3 Operating income 766.8 677.5 622.2 Interest, net 161.1 40.2 172.5 Earnings before income taxes 605.7 637.3 449.7 Income tax expense 1.9 154.8 90.0 Earnings from continuing operations 603.8 $ 482.5 $ 359.7 Edwings oss) from discontinued operations, net of tax expense Nenefit of $(4.8), $(42) and $ 14, respectively (7.8) (3.4) 15.3 Ne earnings Q6.0 $ 479 373.0 Basic net earnings per share: Earnings from continuing operations 4.87 $ 3.88 $ 2.82 Earnings (loss) from discontinued operations (0.06) (0.03) 0.12 Net earnings 4.81 $ 3.89 $ 2.94 Diluted net earnings per share: Earnings from continuing operations $ 4.79 $ 3.83 $ 2.78 Earnings (loss) from discontinued operations (0.06) (0.03) 0.12 Net earnings $ 4.73 $ 3.80 $ 2.90 Average number of common shares outstanding: Basic 124.0 124.3 127.4 Diluted 126,0 126.0 129,3 Dividends declared per common share 2.52 $ 2.24 $ 2.10 $ SA See accompanying notes to consolidated financial statements. DARDEN RESTAURANTS, INC. CONSOLIDATED STATEMENTS OF COMPREHENSIVE INCOME (In millions) May 27, 2018 May 28, 2017 May 29, 2016 Net earnings $ 596.0 $ 479.1 $ 375.0 Other comprehensive income (loss): Foreign currency adjustment (0.9) 0.5 0.5 Change in fair value of marketable securities, net of taxes of $0.0, $0.0 and $0.0, respectively (0.1) Change in fair value of derivatives and amortization of unrecognized gains and losses on derivatives, net of taxes of $0.0, $0.5 and $14.3, respectively (4.6) 4.3 23.0 Net unamortized gain (loss) arising during period, including amortization of unrecognized net actuarial loss, net of taxes of $(0.7), $11.9 and S(16.0), respectively (1.1) 19.3 (23.9) Reclassification of tax effect (15.6) Other comprehensive income (loss) (22.3) S 24.1 $ (0.4) Total comprehensive income $ 573.7 S 503.2 $ 374.6 See accompanying notes to consolidated financial statements. DARDEN RESTAURANTS, INC. CONSOLIDATED BALANCE SHEETS (In millions) May 27, 2018 May 28, 2017 233.1 75.9 178.9 6.2 80.6 13.2 146.9 $ 83.7 205.3 15.9 89.9 11.9 553.6 $ 2,429.8 1,183.7 950.8 351.7 5,469.6 $ $ 587.9 2,272.3 1,201.7 950.2 280.2 5,292.3 $ $ 277.0 $ 177.5 ASSETS Current assets: Cash and cash equivalents Receivables, net Inventories Prepaid income taxes Prepaid expenses and other current assets Assets held for sale Total current assets Land, buildings and equipment, net Goodwill Trademarks Other assets Total assets LIABILITIES AND STOCKHOLDERS' EQUITY Current liabilities: Accounts payable Accrued payroll Accrued income taxes Other accrued taxes Unearned revenues Other current liabilities Total current liabilities Long-term debt Deferred income taxes Deferred rent Other liabilities Total liabilities Stockholders' equity: Common stock and surplus, no par value. Authorized 500.0 shares; issued 124.8 and 126.7 shares, respectively; outstanding 123.5 and 125.4 shares, respectively Preferred stock, no par value. Authorized 25.0 shares; none issued and outstanding Retained earnings Treasury stock, 1.3 and 1.3 shares, at cost, respectively Accumulated other comprehensive income (loss) Unearned compensation Total stockholders' equity Total liabilities and stockholders' equity See accompanying notes to consolidated financial statements, $ 56.6 415.8 457.6 1,384.5 $ 926.5 114.0 318.0 531.8 3,274.8 $ 249.5 149.1 1.9 54.2 388.6 445.9 1,289.2 936.6 145.6 282.8 536.4 3,190.6 $ 1,631.9 1,614.6 657.6 (7.8) (85.2) (1.7) 2,194.8 $ 5,469.6 $ 560.1 (7.8) (62.9) (2.3) 2,101.7 5,292.3 S s DARDEN RESTAURANTS, INC. CONSOLIDATED STATEMENTS OF CHANGES IN STOCKHOLDERS' EQUITY (In millions, except per share data) Common Accumulated Stock Other Total And Retained Treasury Comprehensive Uneamed Stockholders Surplus Earnings Stock Income (Loss) Compensation Equity $ 1,405.9 $ 1,026,0 $ (7.8) $ (86.6) (4.0) $ 2,333.5 375.0 375.0 (0.4) (0.4) (268.2) (268.2) 94.4 94.4 14.9 14.9 17.5 17.5 (34.9) (149.9) (184.8) 4.8 0.1 4.9 (435.4) Balances at May 31, 2015 Net earnings Other comprehensive income Dividends declared ($2.10 per share) Stock option exercises (2.4 shares) Stock-based compensation Income tax benefits credited to equity Repurchases of common stock (3.0 shares) Issuance of stock under Employee Stock Purchase Plan and other plans (0.2 'shares) Separation of Four Corners Property Trust Other Balances at May 29, 2016 Net earnings Other comprehensive income Dividends declared ($2.24 per share) Stock option exercises (2.7 shares) Stock-based compensation Income tax benefits credited to equity Repurchases of common stock (3.7 shares) Issuance of stock under Employee Stock Purchase Plan and other plans (0.2 'shares) III 0.6 (3.3) $ $ 1,502.6 S (7.8) $ 547.5 $ 479.1 (87.0) $ 24.1 (435.4) 0.6 1,952.0 479.1 24.1 (279.6) 107.8 15.6 27.2 (230.2) (279.6) 107.8 15.6 27.2 (43.7) (186.5) IIIIIIIIIIIIIIIIII 5.1 5.3 Other 0.4 (0.4) 560.1 S 596.0 (7.8) (62.9) $ (2.3) S IIIIIIIII (22.3) (315.3) Balances at May 28, 2017 $ 1,614.6 $ Net earnings Other comprehensive income Dividends declared ($2.52 per share) Stock option exercises (0.8 shares) 32.0 Stock-based compensation 22.7 Repurchases of common stock (2.8 shares) (36.0) Issuance of stock under Employee Stock Purchase Plan and other plans (0.1 shares) 5.7 Other (7.1) Balances at May 27, 2018 $ 1,631.9 $ See accompanying notes to consolidated financial statements, III 2,101.7 596.0 (22.3) (315.3) 32.0 22.7 (234.8) (198.8) IT 15,6 657.6 $ 0.1 0.5 (1.7) $ 5.8 9.0 2,194.8 (7.8) $ (85.2) $ DARDEN RESTAURANTS, INC. CONSOLIDATED STATEMENTS OF CASH FLOWS (In millions) May 27, 2018 Fiscal Year Ended May 28, 2017 May 29, 2016 $ 596.0 $ 7.8 479.1 $ 3.4 375.0 (15.3) 313.1 3.4 1.6 42.8 (8.0) (62.0) (11.2) (20.6) 36.6 14.6 102.2 3.5 1,019.8 S 272.9 (8.4) 1.0 40.7 112.6 (1.6) (10.3) (22.9) 32.9 (5.0) 290.2 5.8 3.6 37.3 13.7 (26.5) 3.3 (10.8) 23.8 5.3 106.8 8.2 820.4 21.9 916.3 S $ (228.3) 325.2 Cash flows - operating activities Net earnings (Earings) losses from discontinued operations, net of tax Adjustments to reconcile net earnings from continuing operations to cash flows: Depreciation and amortization Impairments and disposal of assets, net Amortization of loan costs and losses on interest-rate related derivatives Stock-based compensation expense Change in current assets and liabilities Contributions to pension and postretirement plans Change in cash surrender value of trust-owned life insurance Deferred income taxes Change in deferred rent Change in other assets and liabilities Loss on extinguishment of debt Other, net Net cash provided by operating activities of continuing operations Cash flows - investing activities Purchases of land, buildings and equipment Proceeds from disposal of land, buildings and equipment Cash used in business acquisitions, net of cash acquired Purchases of capitalized software and other assets Other, net Net cash provided by (used in) investing activities of continuing operations Cash flows - financing activities Proceeds from issuance of common stock Income tax benefits credited to equity Special cash distribution from Four Corners Property Trust Dividends paid Repurchases of common stock Proceeds from issuance of short-term debt Repayments of short-term debt Repayments of long-term debt Proceeds from issuance of long-term debt Principal payments on capital and financing leases Proceeds from financing lease obligation Other, net Net cash provided by (used) in financing activities of continuing operations Cash flows - discontinued operations Net cash used in operating activities of discontinued operations Net cash provided by investing activities of discontinued operations Net cash used in discontinued operations Decrease in cash and cash equivalents Cash and cash equivalents - beginning of year Cash and cash equivalents - end of year (396.0) 3.3 (40.4) (22.8) 4.8 (451,1) 5 (293.0) 8.3 (764.4) (25.3) 4.7 (1,069.7) $ (23.3) 1.8 75.4 $ 37.8 113.1 27.2 99.3 17.5 315.0 (268.2) (184.8) (279.1) (230.2) (313.5) (234.8) 960.0 (960.0) (408.2) 300.0 (5.4) (1,096.8) (3.4) 500.0 (3.9) 5.7 (3.6) 129.2 S (12.5) (636.6) $ 0.6 (1.120.8) $ S (18.5) 0.2 (18.3) $ (86.2) 233.1 146.95 (18.3) 0.8 (17.5) S (41.7) 274.8 233.1 $ (42.4) 6.3 (36.1) (261.1) 535.9 274.8 DARDEN RESTAURANTS, INC. CONSOLIDATED STATEMENTS OF CASH FLOWS (Continued) (In millions) May 27, 2018 Fiscal Year Ended May 28, 2017 May 29, 2016 $ Cash flows from changes in current assets and liabilities Receivables, net Inventories Prepaid expenses and other current assets Accounts payable Accrued payroll Prepaid/accrued income taxes Other accrued taxes Unearned revenues Other current liabilities Change in current assets and liabilities (6.5) 5.0 (1.1) (9.0) 0.8 (7.2) $ (26.6) (12.5) 12.6 25.9 (9.9) 1.6 33.5 (25.4) (8.0) $ 14.0 (11.8) (10.8) 45.6 (5.9) (21.3) (1.4) 46.0 (40.7) 13.7 41.4 0.4 41.6 40.0 112.6 $ $ See accompanying notes to consolidated financial statements. Table of Contents THE CHEESECAKE FACTORY INCORPORATED CONSOLIDATED BALANCE SHEETS (In thousands, except share data) January 1, 2019 January 2, 2018 ASSETS S 26,578 20,928 Current assets: Cash and cash equivalents Accounts receivable Income taxes receivable Other receivables Inventories Prepaid expenses Total current assets 68,193 38,886 40,645 195,230 6,008 19,865 15,016 67,518 42,560 57,666 208,633 Property and equipment, net 913,275 935,045 Other assets: Intangible assets, net Prepaid rent Investments in unconsolidated affiliates Other Total other assets 26,209 34,961 79,767 64,691 205,628 24,065 39,399 59,521 66,397 189,382 Total assets $ 1,314,133 $ 1,333,060 LIABILITIES AND STOCKHOLDERS' EQUITY $ $ 50,984 Current liabilities: Accounts payable Income taxes payable Gift card liabilities Other accrued expenses Total current liabilities 49,071 712 172,336 194,381 416,500 163,951 183,016 397,951 52,123 79,697 113,095 10,000 71,659 57,216 74,761 108,627 10,000 70,975 Deferred income taxes Deferred rent liabilities Deemed landlord financing liability Long-term debt Other noncurrent liabilities Commitments and contingencies (Note 11) Stockholders' equity Preferred stock, 8.01 par value, 5,000,000 shares authorized; none issued Common stock, S.01 par value, 250,000,000 shares authorized; 96,621,990 and 95,412,030 shares issued at January 1, 2019 and January 2, 2018, respectively Additional paid in capital Retained earnings Treasury stock, 51,791,941 and 49,534,212 shares at cost at January 1, 2019 and January 2, 2018, respectively Accumulated other comprehensive loss Total stockholders' equity Total liabilities and stockholders' equity 967 828,676 1,384,494 (1,642,140) (938) 571,059 954 799,862 1,345,666 (1,532,864) (88) 613,530 1,314,133 $ 1,333,060 See the accompanying notes to the consolidated financial statements. SI Table of Contents THE CHEESECAKE FACTORY INCORPORATED CONSOLIDATED STATEMENTS OF INCOME (In thousands, except per share data) 2018 Fiscal Year 2017 2,260,502 2,332,331 S 2016 2,275,719 Revenues Costs and expenses: Cost of sales Labor expenses Other operating costs and expenses General and administrative expenses Depreciation and amortization expenses Impairment of assets and lease terminations Preopening costs Total costs and expenses Income from operations Loss on investments in unconsolidated affiliates Interest and other expense, net Income before income taxes Income tax provision/benefit) Net income 532,880 834,134 566,825 154,770 95,976 17,861 10,937 2,213,383 118,948 (4,754) (6,783) 107,411 8,376 99,035 519,388 777,595 552,791 141,533 92,729 10,343 13,278 2,107,657 152,845 (479) (5,900) 146,466 (10,926) 157,392 526,628 759,998 540,365 146,042 88,010 114 13,569 2,074,726 200,993 (9,225) 191,768 52,274 139,494 S Net income per share: Basic Diluted $ 2.19 2.14 S s 3.35 3.27 2.91 2.83 $ Weighted average shares outstanding: Basic Diluted 45,263 46,215 46,930 48,152 47,981 49,372 Cash dividends declared per common share 1.06 $ 0.88 1.24 $ See the accompanying notes to the consolidated financial statements. 52 Table of Contents THE CHEESECAKE FACTORY INCORPORATED CONSOLIDATED STATEMENTS OF COMPREHENSIVE INCOME (In thousands) 2018 99,035 Fiscal Year 2017 157,392 S 2016 139,494 Net income Other comprehensive loss: Foreign currency translation adjustment Other comprehensive loss Total comprehensive income (850) (850) 98,185 (88) (88) 157,304 139,494 See the accompanying notes to the consolidated financial statements. 53 Table of Contents THE CHEESECAKE FACTORY INCORPORATED CONSOLIDATED STATEMENTS OF STOCKHOLDERS' EQUITY (In thousands) Shares of Common Stock Common Stock Additional Paid-in Capital Retained Earnings Accumulated Other Comprehensive Loss Treasury Stock Total 93,127 $ 931 $ 710,242 $ 1,140,788 $ (1,263,422) S 139,494 (42,270) 588,539 139,494 (42,270) 11 13,722 21,811 13,722 21,811 1,545 16 28,362 - 94,672 947 774,137 1,238,012 157,392 (146,467) (1,409,889) 28,378 (146,467) 603,207 157,392 (88) 11! 111 (49,738) (88) (49,738) 16,696 16,696 Balance, December 29, 2015 Net income Cash dividends declared Tax impact of stock options exercised, net of cancellations Stock-based compensation Common stock issued under stock-based compensation plans Treasury stock purchases Balance, January 3, 2017 Net income Foreign currency translation adjustment Cash dividends declared Stock-based compensation Common stock issued under stock-based compensation plans Treasury stock purchases Balance, January 2, 2018 Cumulative effect of adopting the pronouncement related to revenue recognition Balance, January 2, 2018, as adjusted Net income Foreign currency translation adjustment Cash dividends declared Stock-based compensation Common stock issued under stock-based compensation plans Treasury stock purchases Balance, January 1, 2019 740 7 9,029 9,036 (122,975) 613,530 (122,975) (1,532,864) 95,412 954 799,862 1,345,666 (88) (3,560) 95,412 954 799,862 1,342,106 99,035 (1,532,864) (88) (3,560) 609,970 99,035 (850) (56,647) (850) (56,647) 20,251 554 20,245 656 7 8,569 8,576 (109,276) (938) $ 571,059 (109,276 (1,642,140) $ 96,622 $ 962 828,676 5 1,384,494 See the accompanying notes to the consolidated financial statements. 54 THE CHEESECAKE FACTORY INCORPORATED CONSOLIDATED STATEMENTS OF CASH FLOWS (In thousands) Fiscal Year 2017 2018 2016 $ 99,035 $ 157,392 S 139,494 95,976 (5,510) 16,411 19,988 92,729 (25,180) 10,586 16,457 88,010 (1,005) 114 21,473 13,722 4,754 479 3,592 Cash flows from operating activities: Net income Adjustments to reconcile net income to cash provided by operating activities: Depreciation and amortization expenses Deferred income taxes Impairment of assets and lease terminations Stock-based compensation Tax impact of stock options exercised, net of cancellations Loss from investments in unconsolidated affiliates Other Changes in assets and liabilities: Accounts receivable Other receivables Inventories Prepaid expenses Other assets Accounts payable Income taxes receivable/payable Other accrued expenses Cash provided by operating activities Cash flows from investing activities: Additions to property and equipment Additions to intangible assets Investments in unconsolidated affiliates Proceeds from variable life insurance contract Cash used in investing activities Cash flows from financing activities: Deemed landlord financing proceeds Deemed landlord financing payments Borrowings on credit facility Repayments on credit facility Proceeds from exercise of stock options Cash dividends paid Treasury stock purchases Cash used in financing activities Foreign currency translation adjustment Net change in cash and cash equivalents Cash and cash equivalents at beginning of period Cash and cash equivalents at end of period (1,018) 4,698 3,667 6,262 7,406 5,601 15,729 18,316 291,315 (4,233) (2,955) (7,634) (5,227) (9,034) 3,771 (17,315) 28,960 238,796 (1,473) 8,066 (916) (10,462) (2,818) 752 21,837 35,995 316,381 (102,909) (3,020) (25,000) 540 (130,389) (120,779) (1,654) (18,000) (115,821) (1,640) (42,000) (140,433) (159,461) 21.788 (5,128) 70,000 (70,000) 8,576 (56,251) (109,276) (140,291) (65) 20,570 6,008 26,578 12,128 (4,391) 85,000 (75,000) 9,036 (49,889) (122,975) (146,091) (103) (47,831) 53,839 6,008 17,246 (3,721) 35,000 (35,000) 28,378 (42,371) (146,467) (146,935) 9.985 43,854 53,839 $ $ 8,156 10,149 4,585 S S S 7,128 31,582 12,145 $ $ $ 6,038 17,932 6,541 $ Supplemental disclosures: Interest paid Income taxes paid Construction payable Non-cash operating: Settlement of sale-leaseback accounting Non-cash investing Settlement of landlord sale-leaseback accounting Non-cash financing Settlement of landlord financing obligation for sale-leaseback leases Deemed landlord financing proceeds $ 11,863 $ 6,824 $ (18,687) $ 13,748 $ See the accompanying notes to the consolidated financial statements
Step by Step Solution
There are 3 Steps involved in it

Get step-by-step solutions from verified subject matter experts