

Question: Please answer the questions below based on graphs I attached. a.Report the correlation matrix of Y and all Xs. b.Based on the correlation matrix, discuss

Please answer the questions below based on graphs I attached.
a.Report the correlation matrix of Y and all Xs.
b.Based on the correlation matrix, discuss the relationship between y and each x. Are they highly correlated? Is the relationship positive or negative?


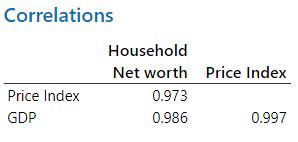

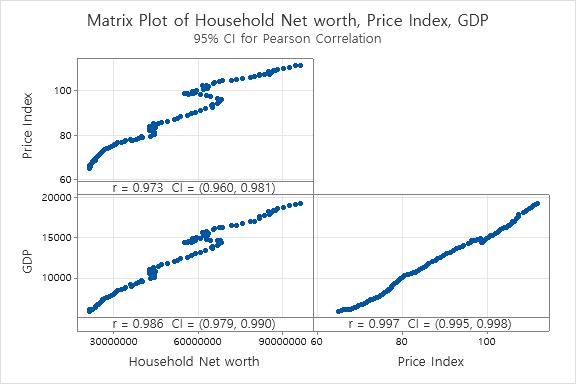
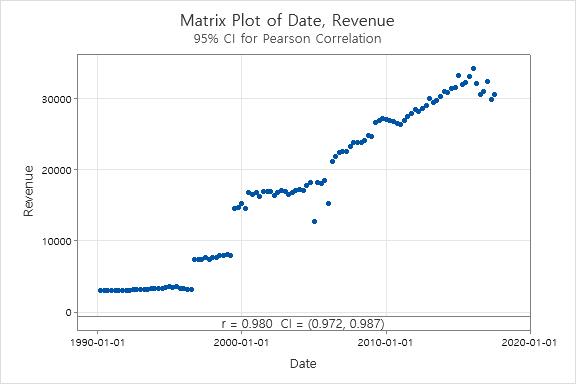
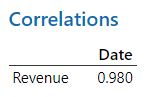
Matrix Plot of Household Net worth, Price Index, GDP 95% CI for Pearson Correlation 100 Price Index 80- 60 r = 0.973 CI = (0.960, 0.981) 20000 15000 GDP 10000 r = 0.986 CI = (0.979, 0.990) T = 0.997 CI = (0.995, 0.998) 30000000 60000000 90000000 60 80 100 Household Net worth Price IndexMatrix Plot of Date, Revenue 95% CI for Pearson Correlation 30000 20000 Revenue 10000 r = 0.980 CI = (0.972, 0.987) 1990-01-01 2000-01-01 2010-01-01 2020-01-01 DateCorrelations Household Net worth Price Index Price Index 0.973 GDP 0.986 0.997Correlations Date Revenue 0.980
Step by Step Solution
There are 3 Steps involved in it

Get step-by-step solutions from verified subject matter experts