

Question: Please answer the questions below. Below are graphical representations of data regarding high temperatures on Thanksgiving Day in New York City. 70 - . .
Please answer the questions below.
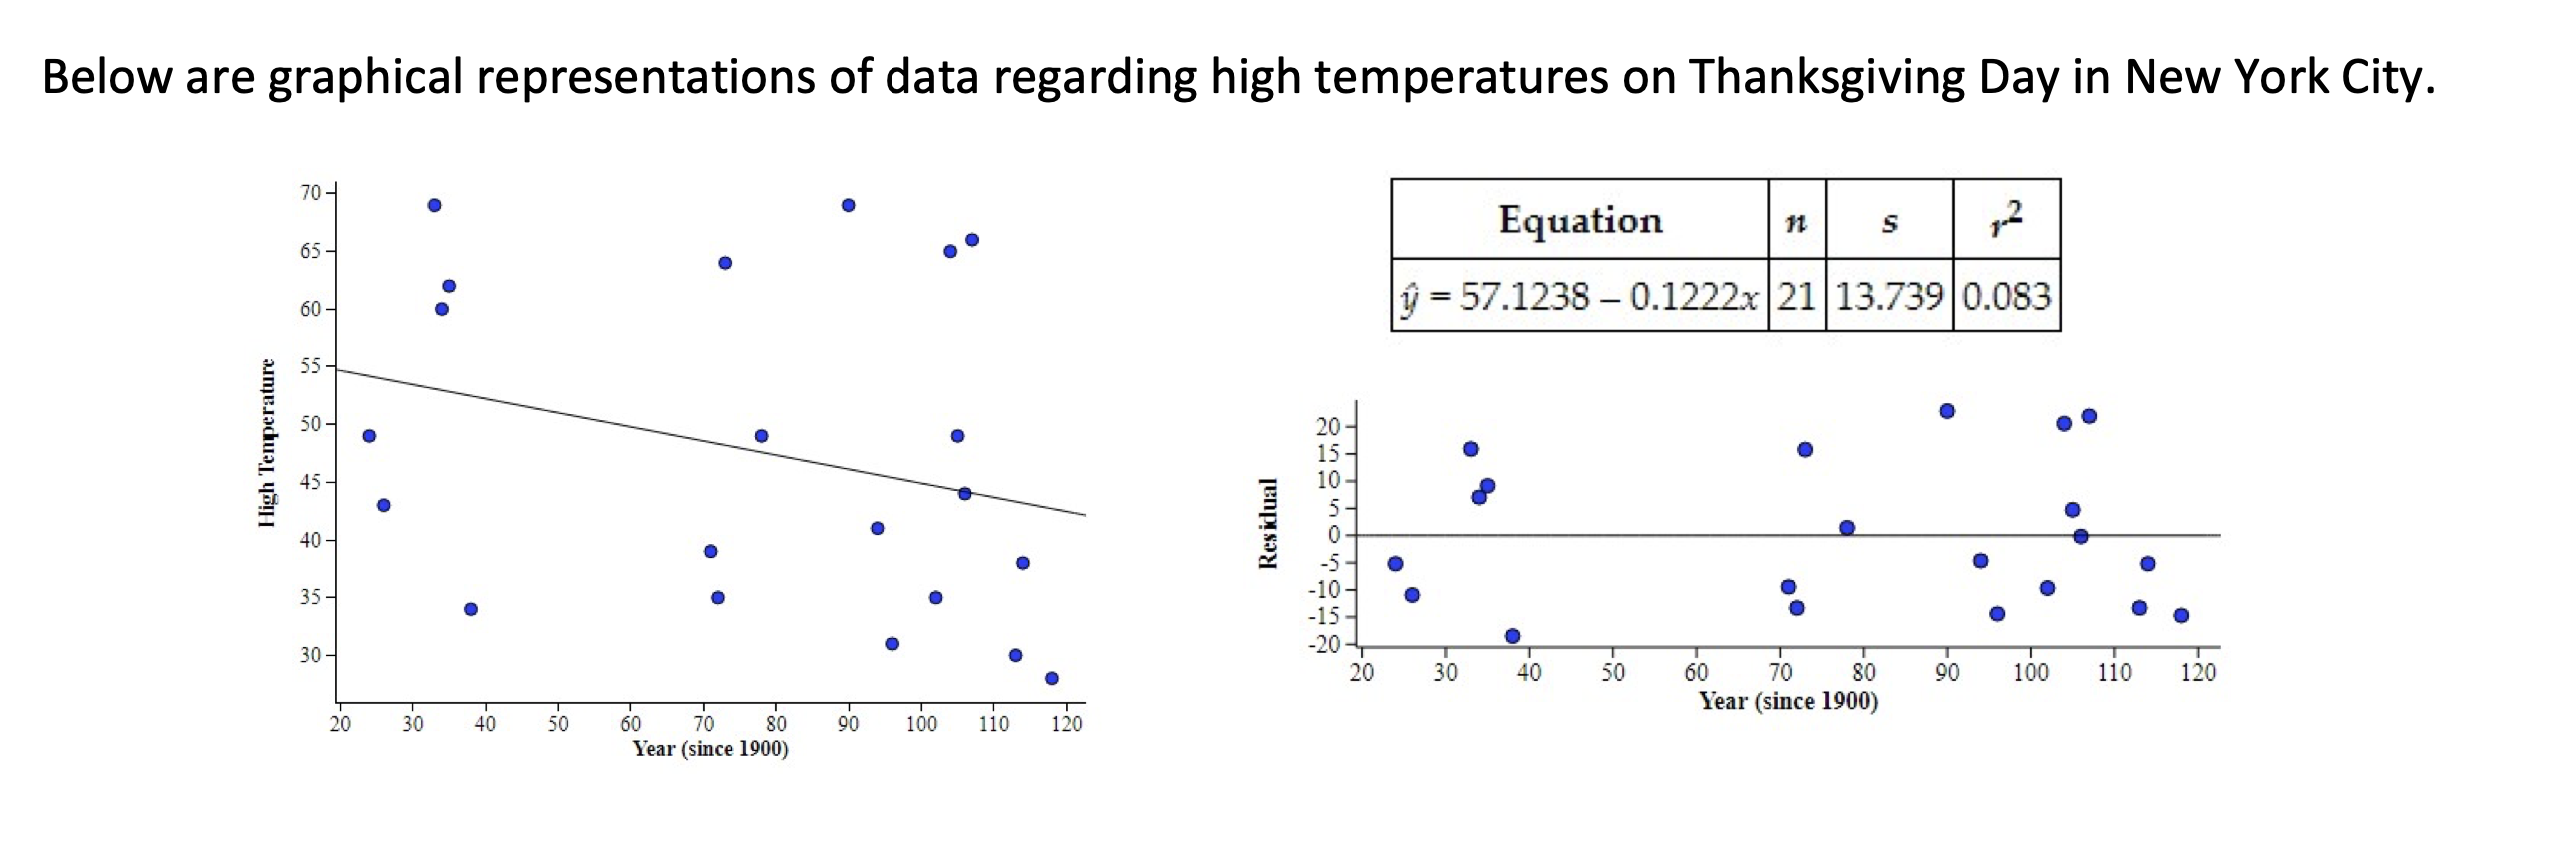
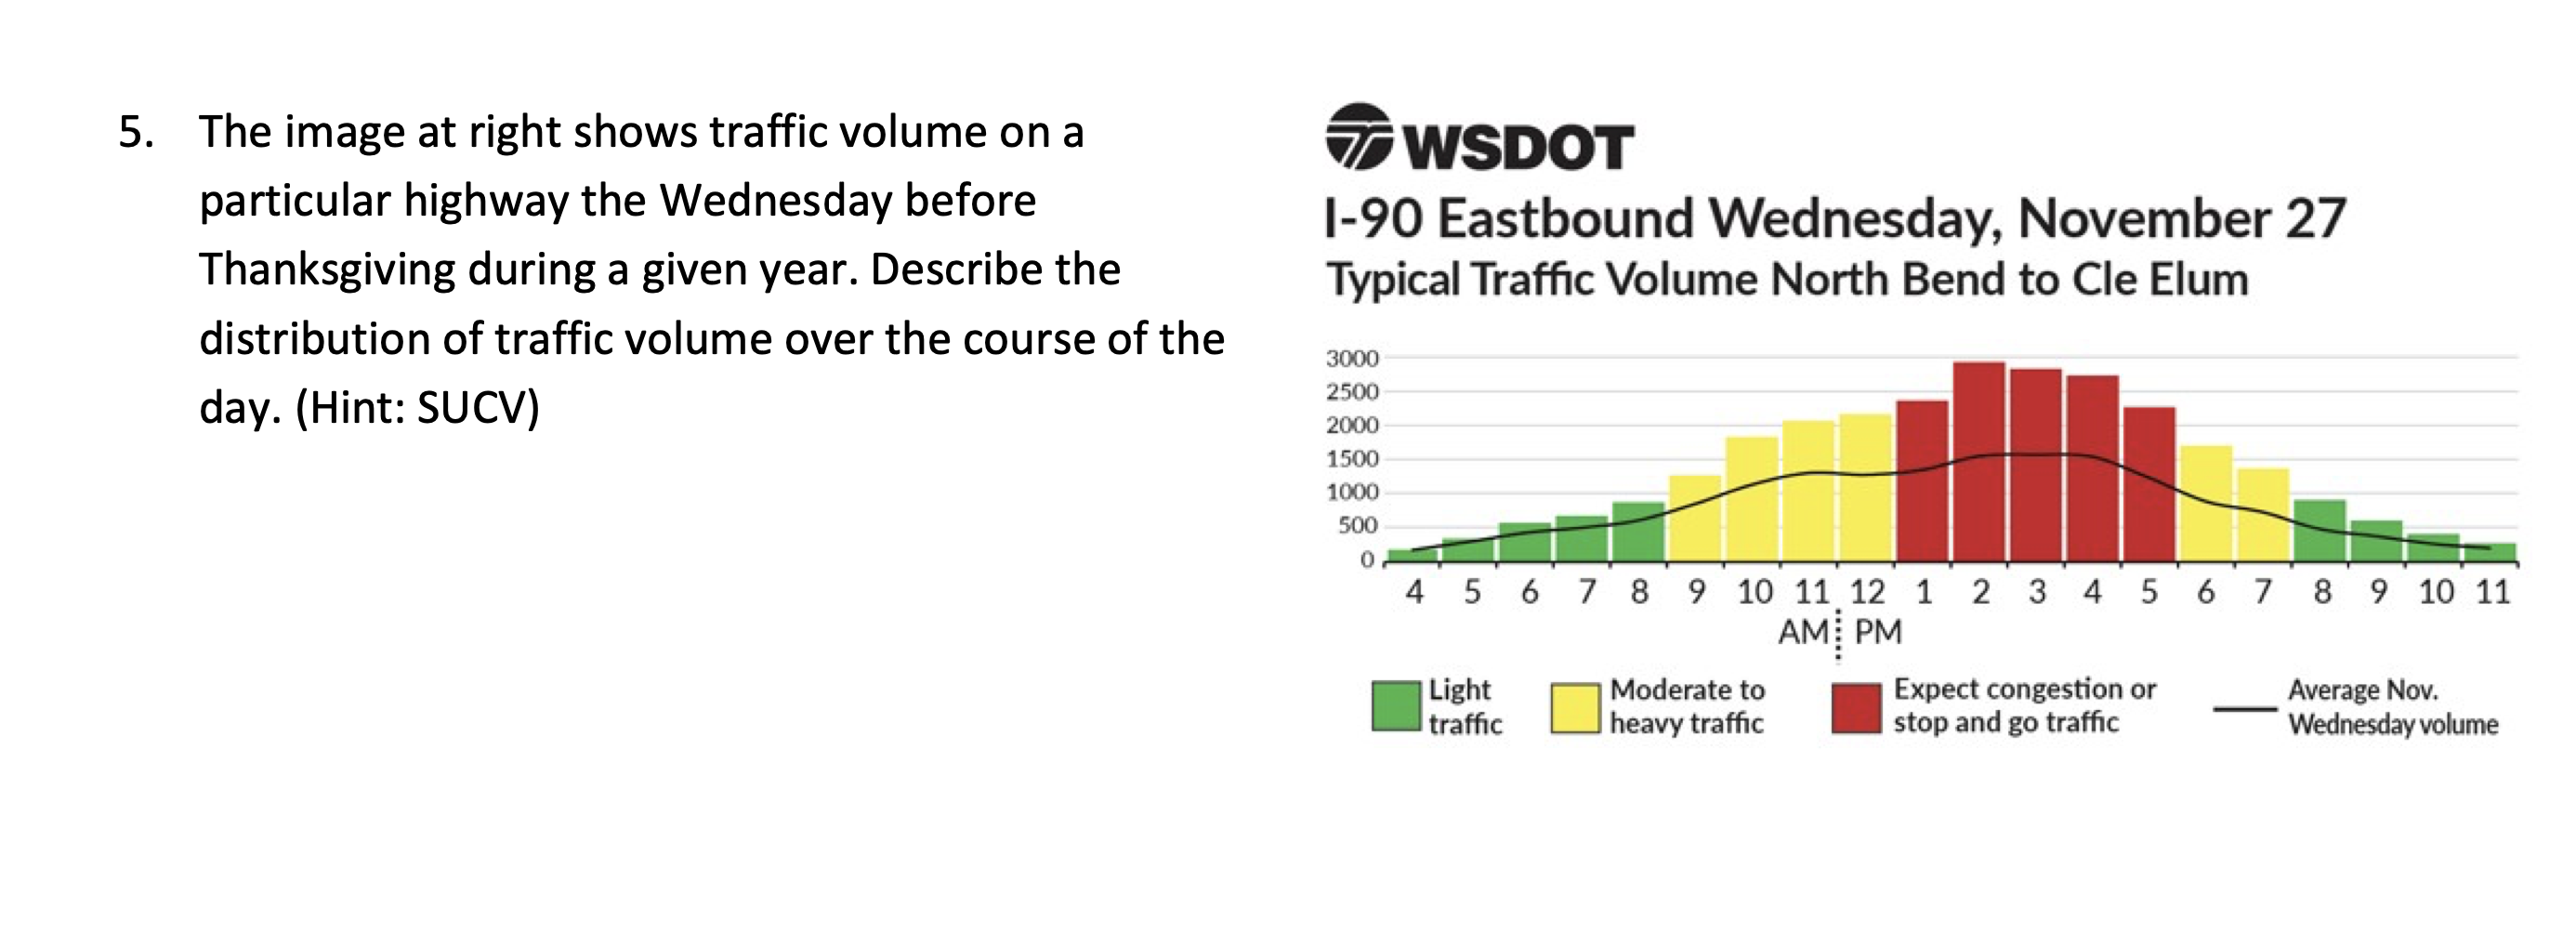
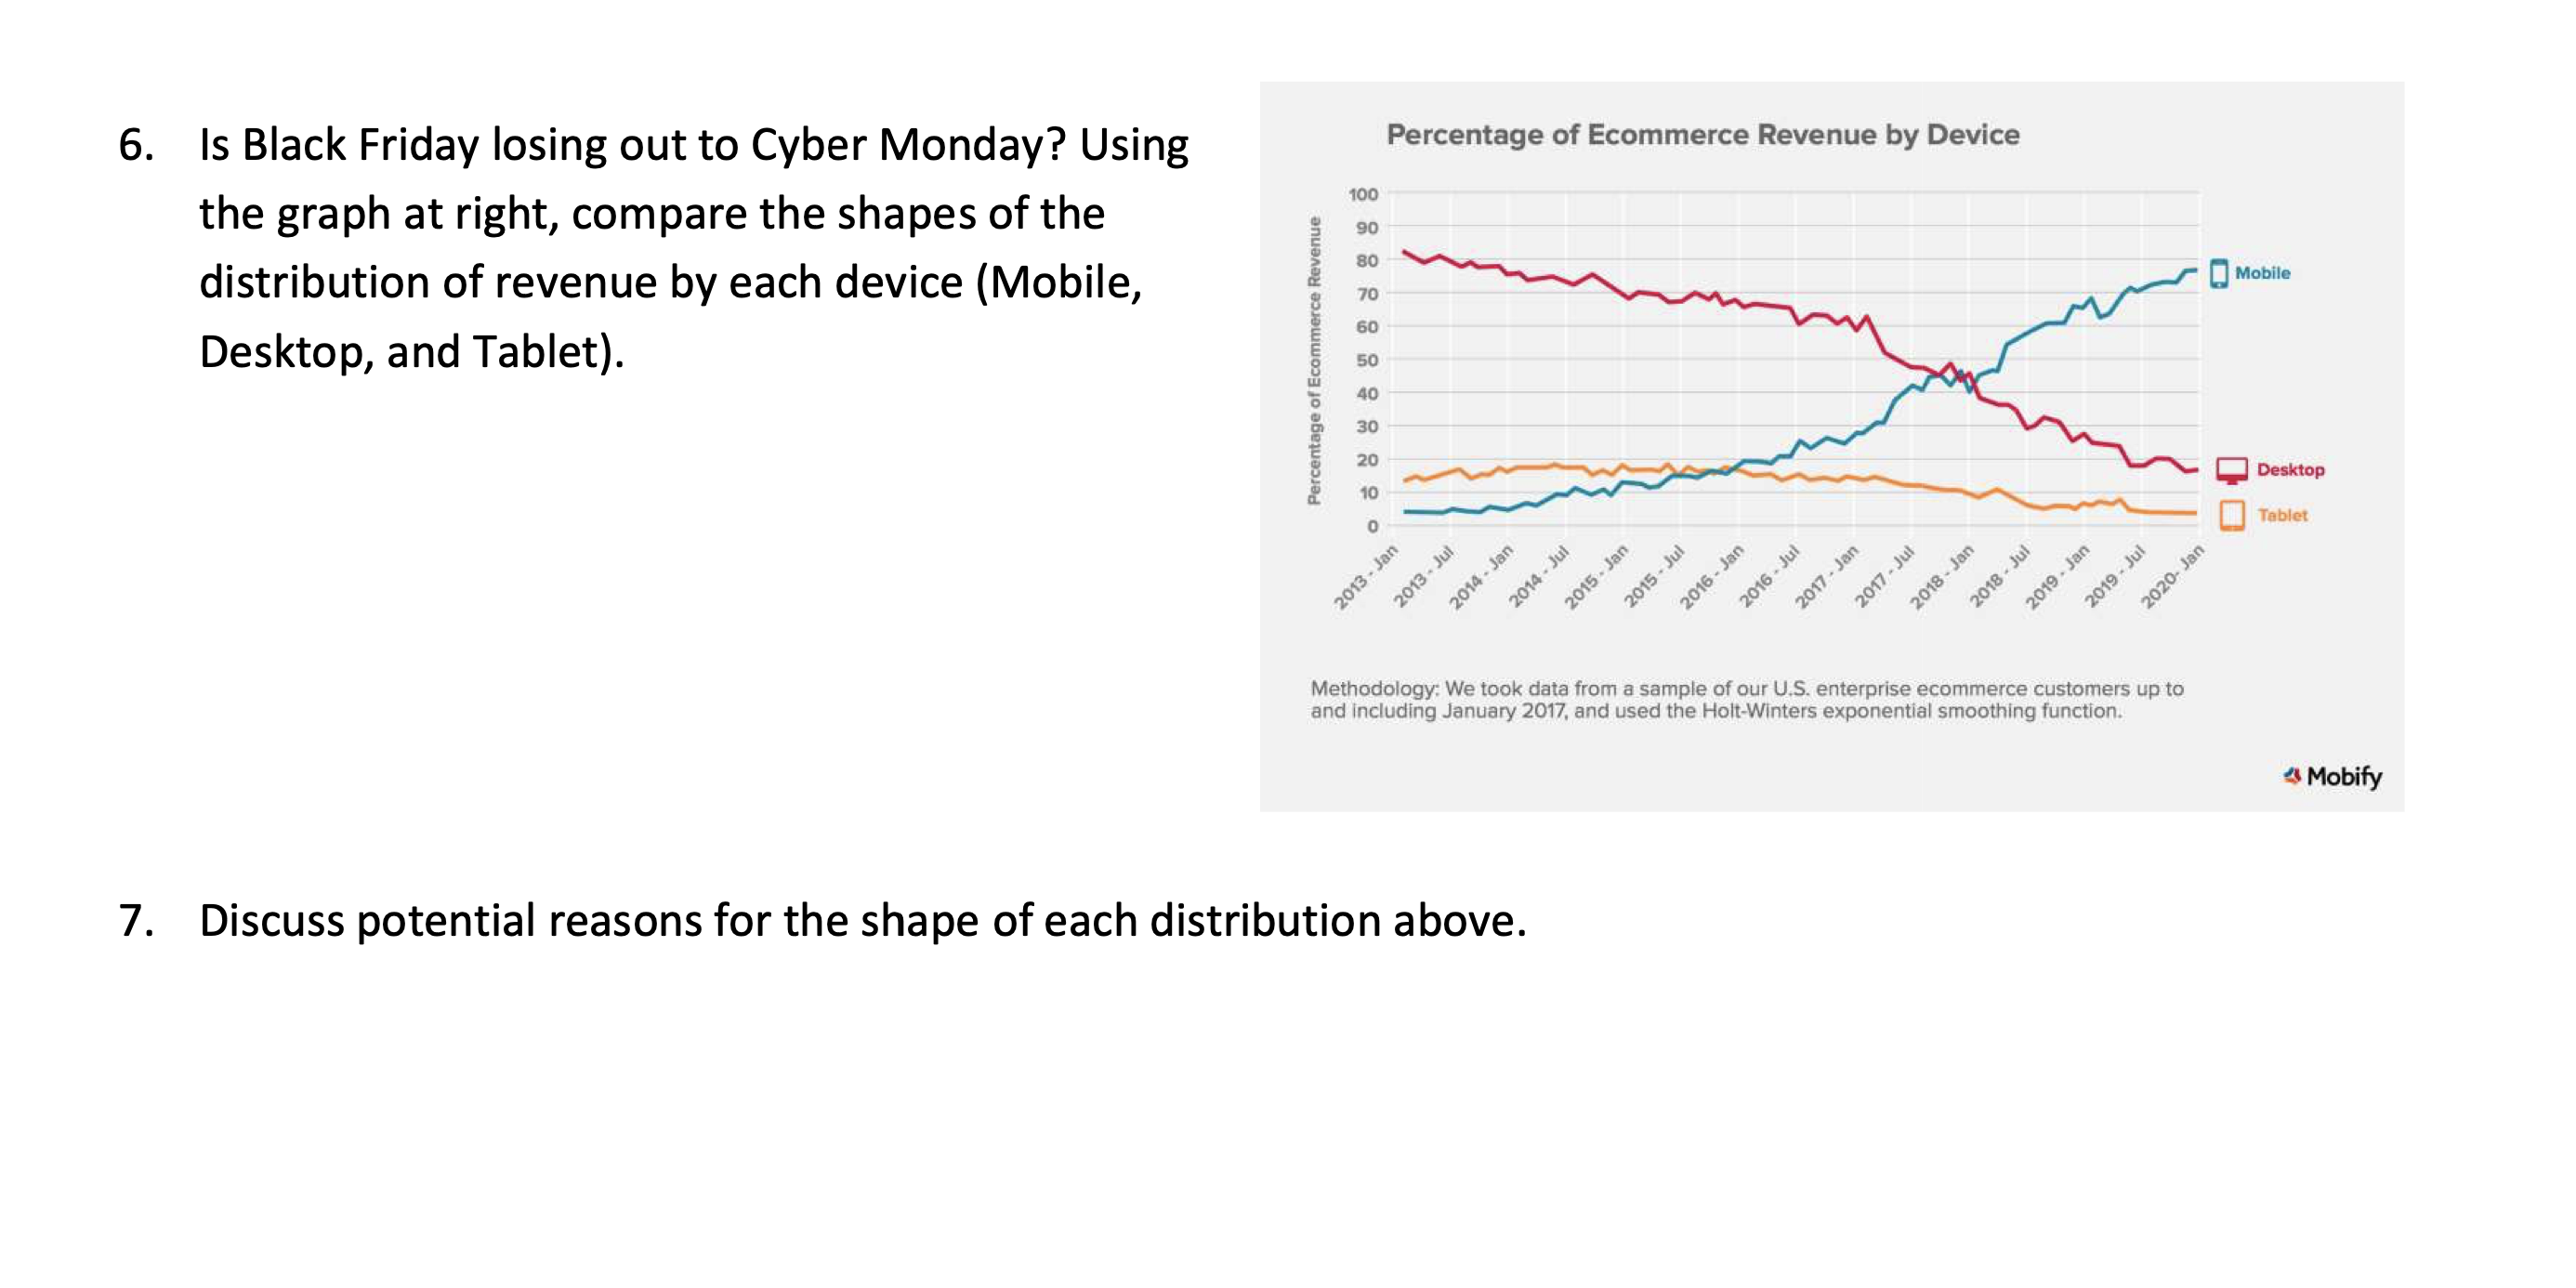
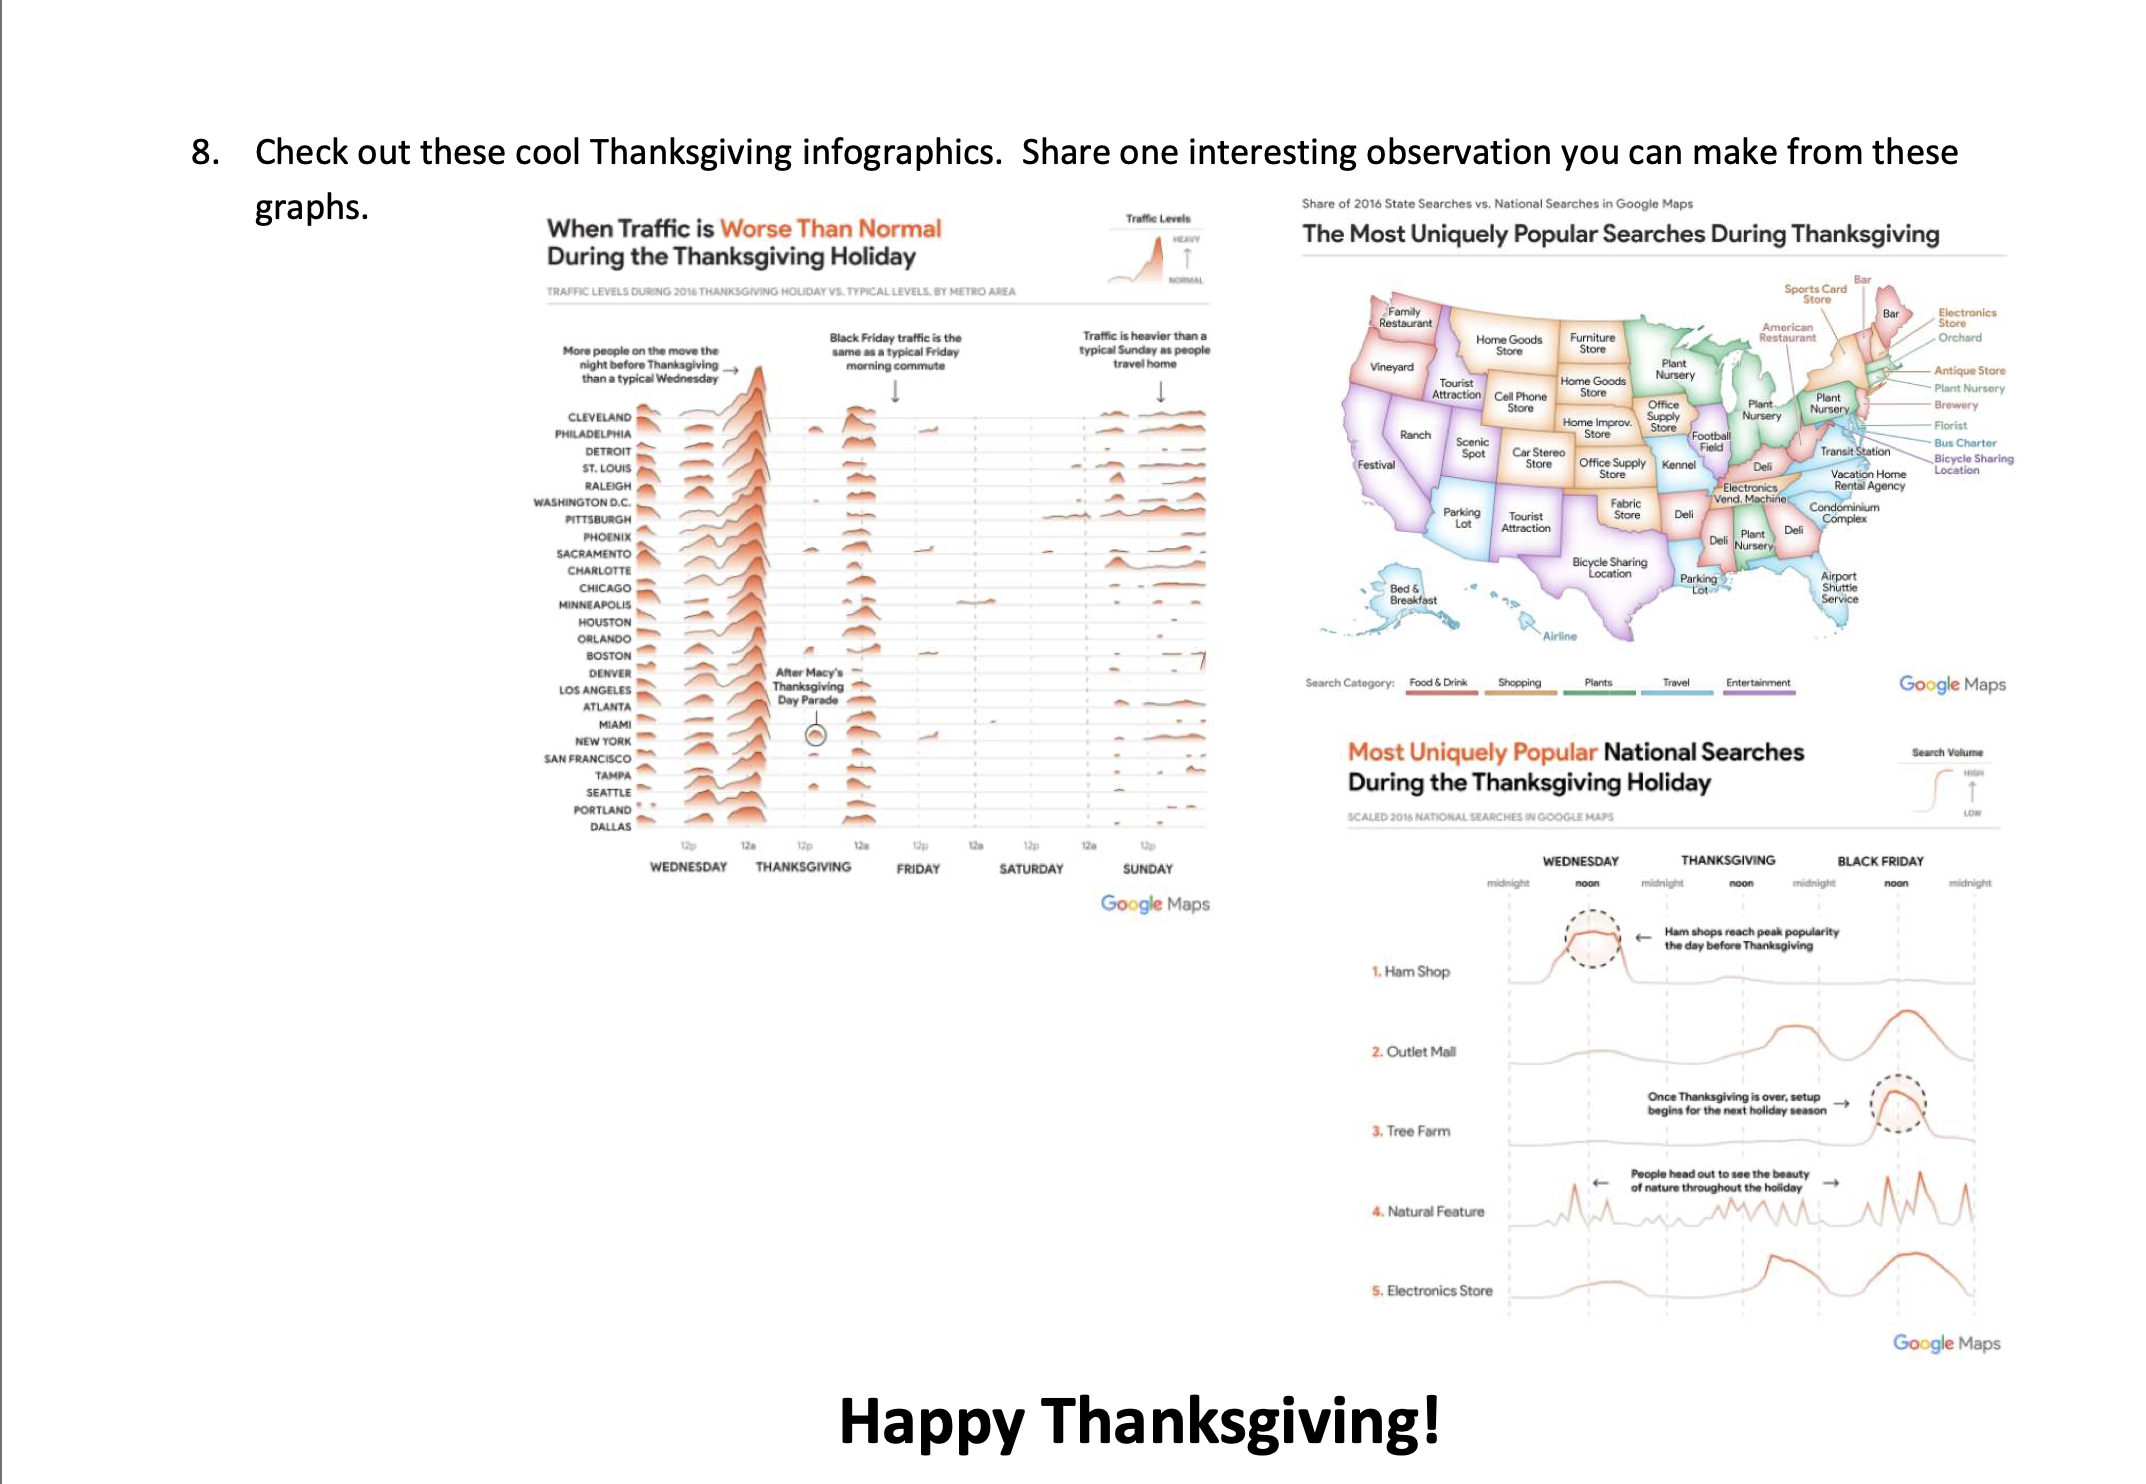
Below are graphical representations of data regarding high temperatures on Thanksgiving Day in New York City. 70 - . . Equation S 65 - 60 y =57.1238 - 0.1222x 21 13.739 0.083 55- 50 High Temperature 45 Residual 40 . 35 30- -20- 20 30 40 50 60 70 80 90 100 110 120 Year (since 1900) 20 30 40 50 50 70 80 90 100 110 120 Year (since 1900)5. The image at right shows traffic volume on a 4 WSDOT particular highway the Wednesday before 1-90 Eastbound Wednesday, November 27 Thanksgiving during a given year. Describe the Typical Traffic Volume North Bend to Cle Elum distribution of traffic volume over the course of the 3000 day. (Hint: SUCV) 2500 2000 1500 1000 500 0 4 5 6 7 8 9 10 11 12 1 2 3 4 5 6 7 8 9 10 11 AM PM Light Moderate to Expect congestion or Average Nov. traffic heavy traffic stop and go traffic Wednesday volume6. Is Black Friday losing out to Cyber Monday? Using Percentage of Ecommerce Revenue by Device the graph at right, compare the shapes of the 100 90 80 distribution of revenue by each device (Mobile, 70 Mobile 60 Desktop, and Tablet). Percentage of Ecommerce Revenue Desktop Tablet Jan 3- Jul 6 - Jan - Jul Jut Jan 2014 - Ja 015 - 2017 - Jan 2018 - Jul 019 - 201 2014 2015 2016 2016 2018- 2020 Methodology: We took data from a sample of our U.S. enterprise ecommerce customers up to and including January 2017, and used the Holt-Winters exponential smoothing function. " Mobify 7. Discuss potential reasons for the shape of each distribution above.8. Check out these cool Thanksgiving infographics. Share one interesting observation you can make from these graphs. Share of 2016 State Sear in Google Maps When Traffic is Worse Than Normal The Most Uniquely Popular Searches During Thanksgiving During the Thanksgiving Holiday TRAFFIC LEVELS L LEVELS, BY METRO AREA Sports Card Family lectronics American Black Friday traffic is the Traffic is heavier than a Home Goods Furniture Restaurant More people on the move the ame as a typical Friday typical Sunday as people Store Store night before Thanksgiving_ morning commute travel home Vineyard Antique Store ical Wednesday Tourist ome Good Attraction Cell Phone - Plant Nursery Plant Nursery Brewery CLEVELAND ome Imp Florist HILADELPHIA Store ooth DETROIT Transit Station Bus Charter Spot Bicycle Sharing ST. LOUIS Office Supply Store Vacation Home RALEIGH HO Rental Agency WASHINGTON D.C. end, Machine Joust Store ondomini Deli PITTSBURGH Complex traction Deli PHOENIX Deli Plant ACRAMENTO cycle Sharing CHARLOTTE Location irking CHICAGO INNEAPOLIS HOUSTON airline ORLANDO BOSTON LOS ANGELES Search Category: Food & Drink Travel Entertainment Google Maps ATLANTA Day Parade MIAMI NEW YORK O SAN FRANCISCO Most Uniquely Popular National Searches Search Volume TAMPA SEATTLE During the Thanksgiving Holiday LAND * * DALLAS SCALED 2016 N 12p up WEDNESDAY THANKSGIVING FRIDAY SATURDAY SUNDAY WEDNESDAY THANKSGIVING BLACK FRIDAY midnight dnight midnight Google Maps Ham shops reach peak popularity the day before Thanksgiving 1. Ham Shop 2. Outlet Mall Once Thanksgiving is over, setup begins for the next holiday season 3. Tree Farm People head out to see the beauty f nature throughout the holiday 4. Natural Feature 5. Electronics Store Google Maps Happy Thanksgiving!Describe the association shown in the scatterplot. (Hint: DU FS) Calculate the correlation coefficient, r. Based on the residual plot, does the linear model fit to the data seem appropriate? What is the predicted temperature for the year 2020
Step by Step Solution
There are 3 Steps involved in it

Get step-by-step solutions from verified subject matter experts