

Question: Please answer the questions below John recently obtained the quarterly revenue data for Intel 'om 990 to I995. He is interested in studying the pater


Please answer the questions below
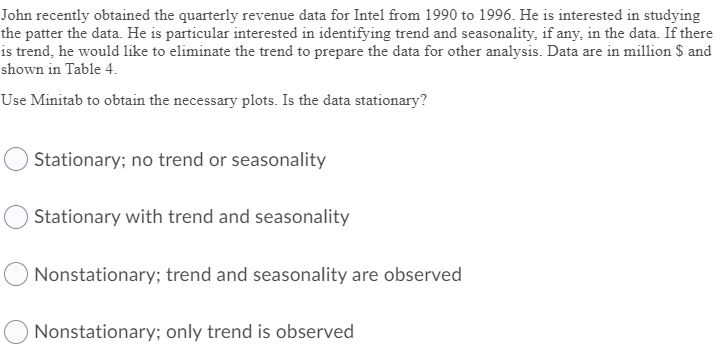
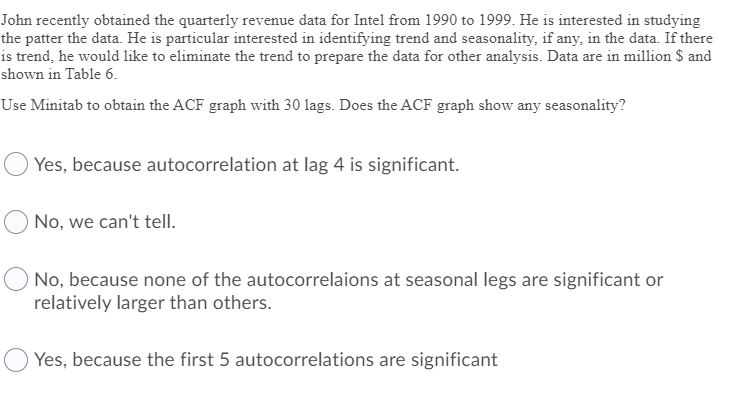


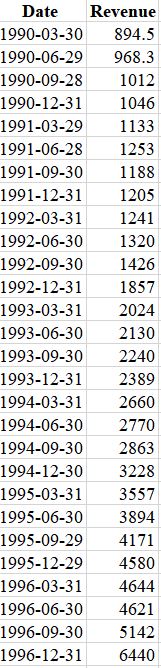
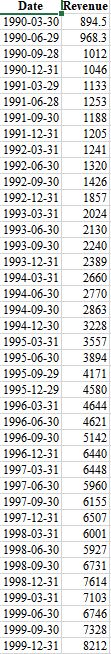
John recently obtained the quarterly revenue data for Intel 'om 990 to I995. He is interested in studying the pater the data. He is particular interested in identifying trend and seasonality, if any, in the data If there is trend, he would like to eliminate the trend to prepare the data for other analysis. Data are in million $ and shown in Table 4. Use Minltab to obtain the necessarj,r plots. Is the data stationary? O Stationary; no trend or seasonality O Stationary with trend and seasonality O Nonstationary; trend and seasonality are observed 0 Nonstationary; only trend is observed John recentlyr obtained the quarterly revenue data for Intel from 1990 to 1999- He is interested in studying the pater the data. He is particular interested in identifying trend and seasonality, if any, in the data. If there is trend, he would like to eliminate the trend to prepare the data for other analysis. Data are in million 3 and shown in Tabie 6- Use Minitab to obtain the ACF graph with 30 lags. Does the ACF graph Show any seasonality? 0 Yes, because autocorreiation at lag 4 is significant. 0 No. we can't tell. 0 No. because none of the autocorrelaions at seasonal legs are significant or relatively larger than others. 0 Yes, because the first 5 autocorrelations are significant
Step by Step Solution
There are 3 Steps involved in it

Get step-by-step solutions from verified subject matter experts