

Question: Please answer the questions in the image below and please include your explanations. QUESTION 7 7. Which of the following statement is correct about the
Please answer the questions in the image below and please include your explanations.
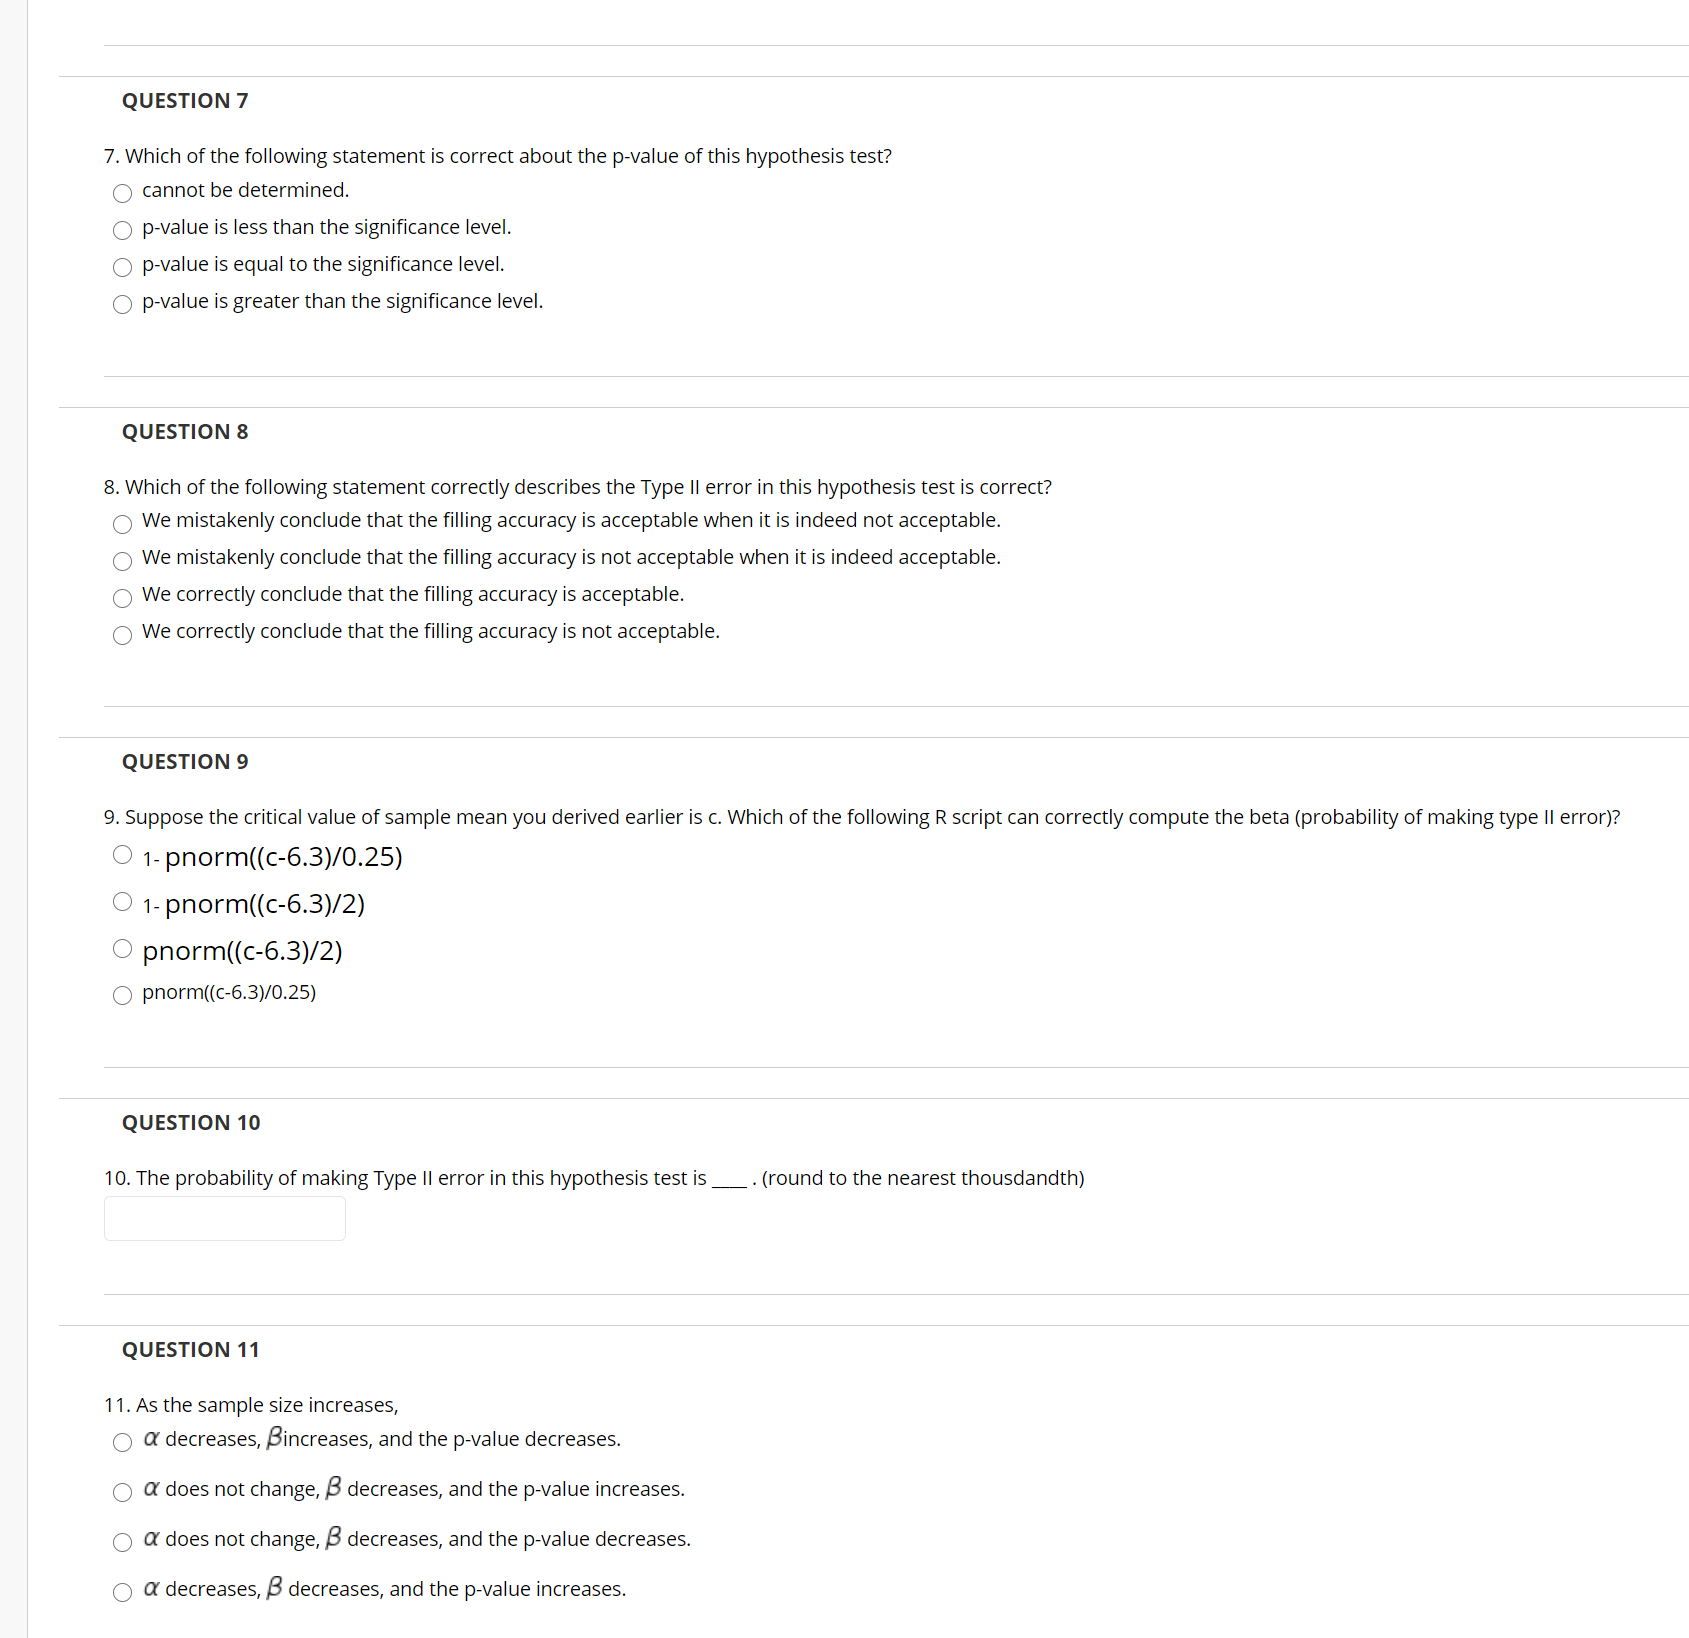
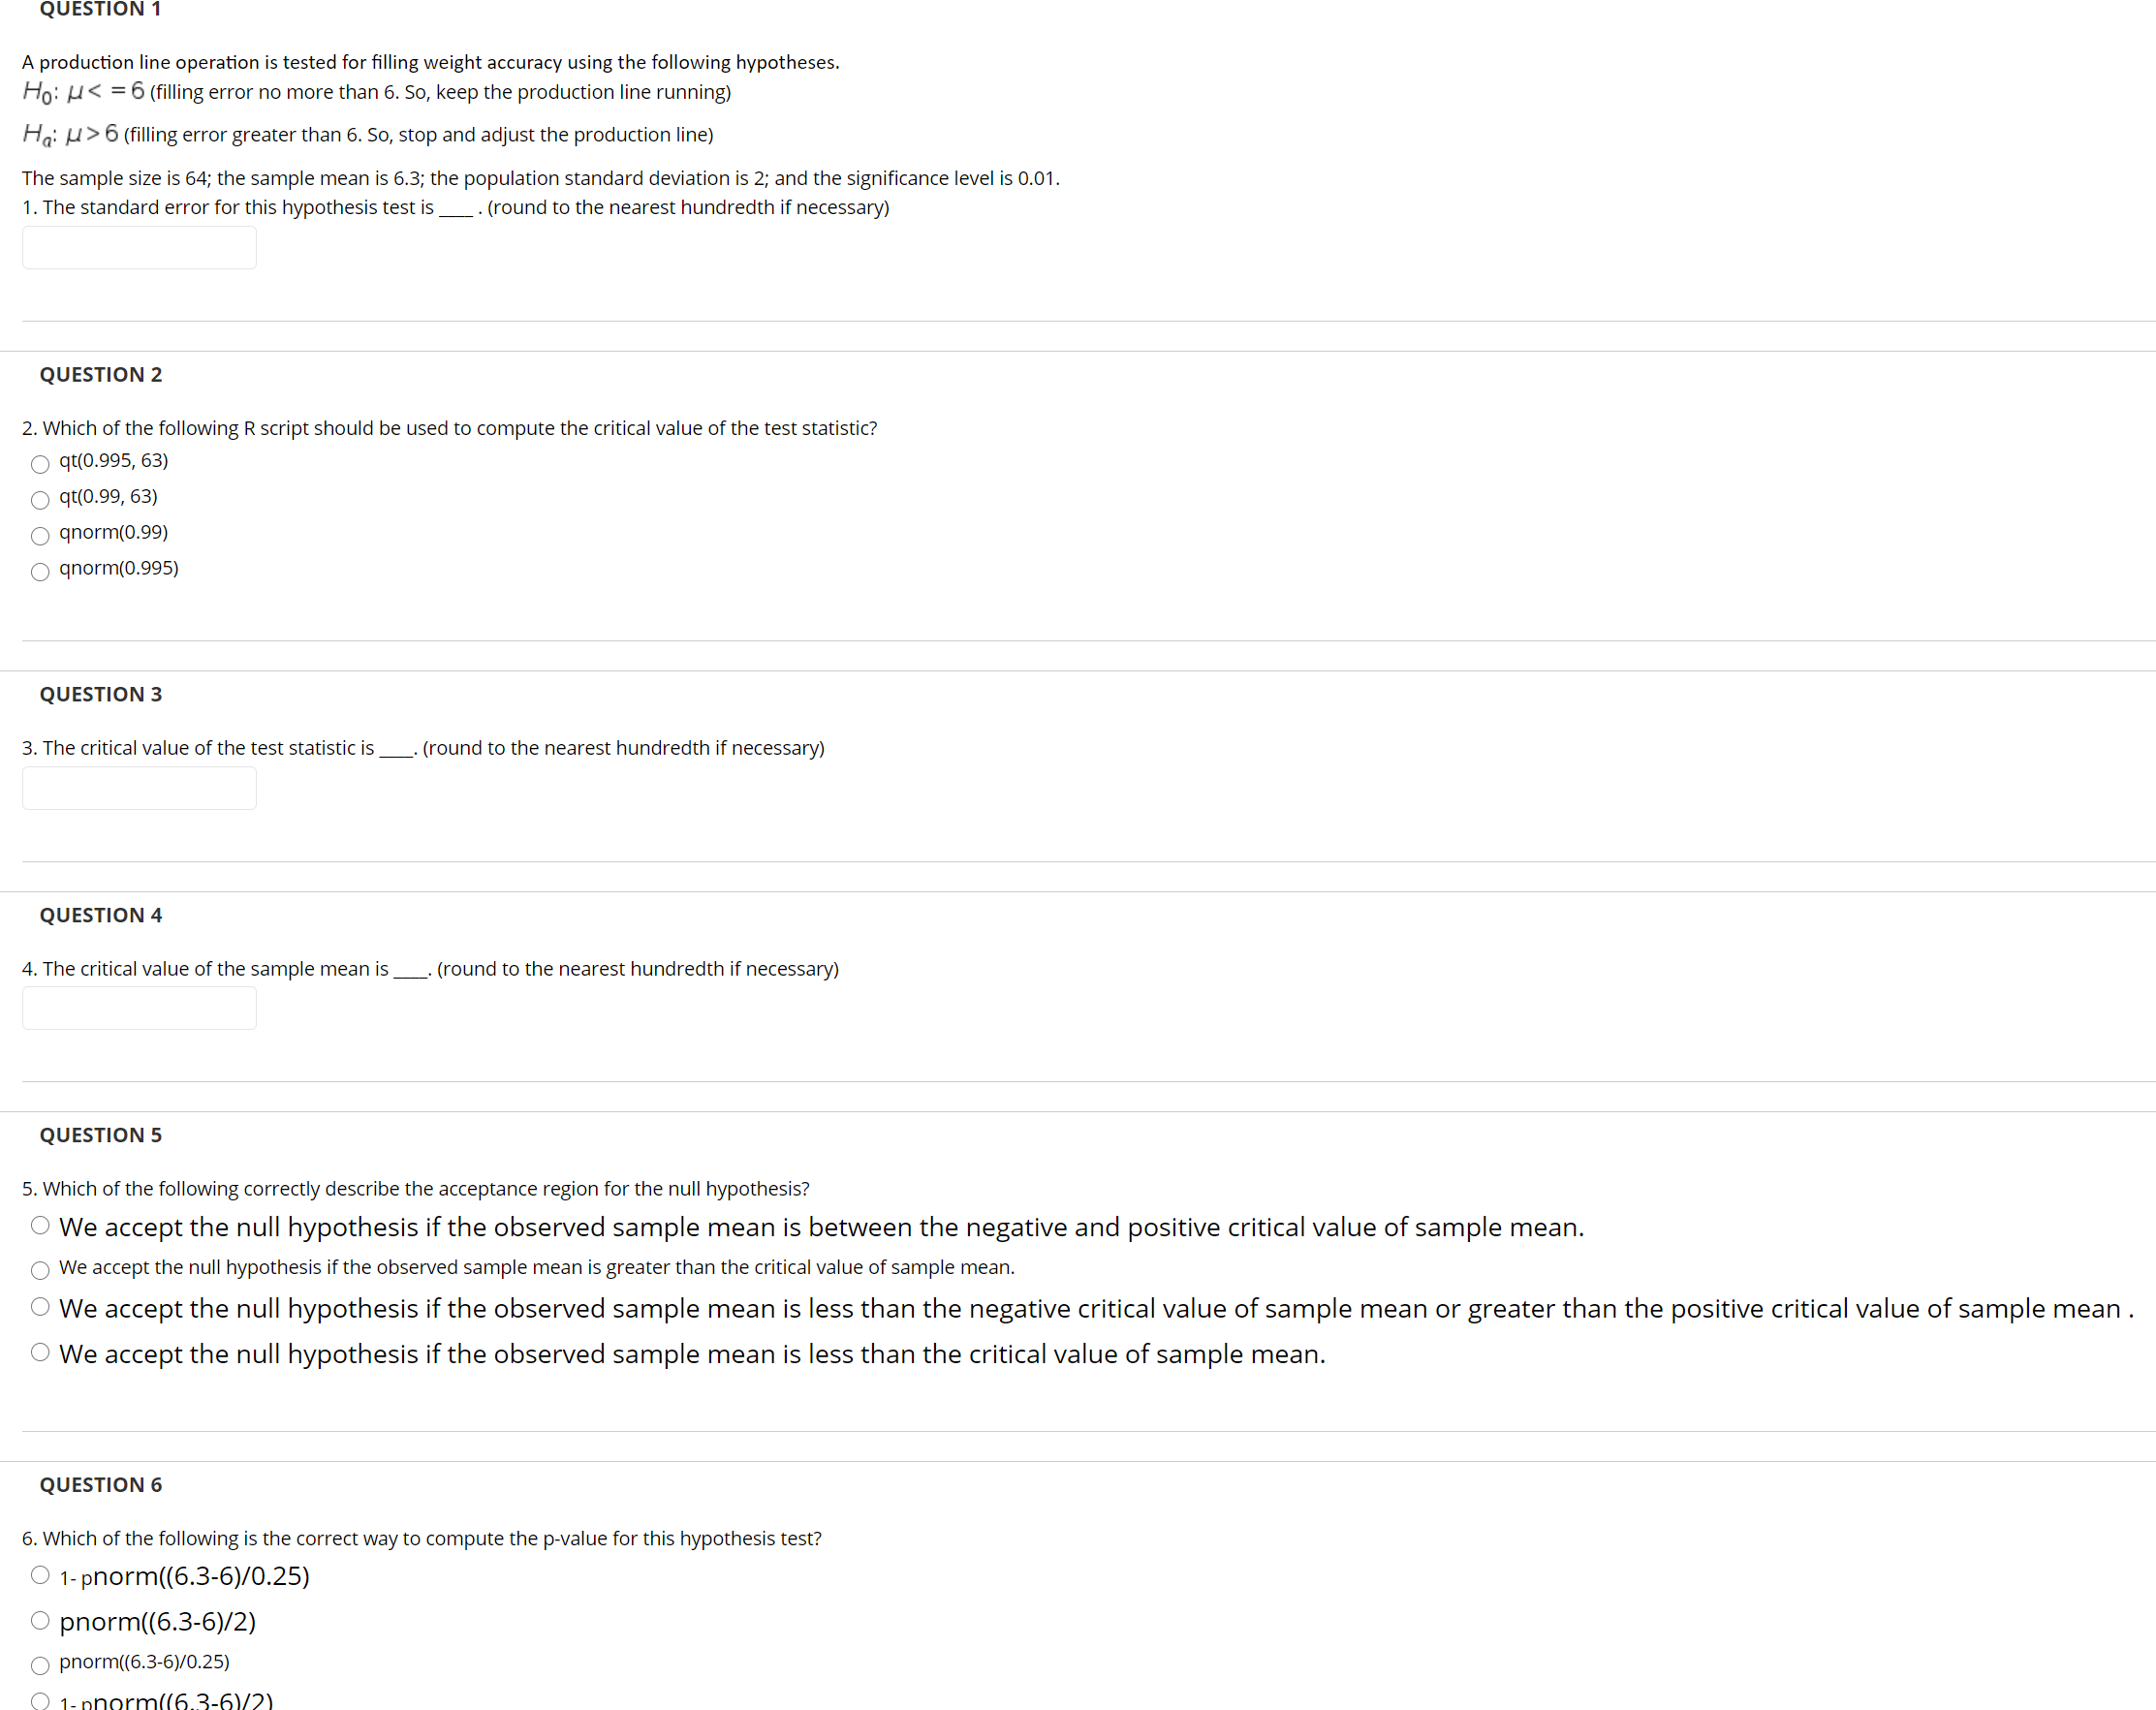
QUESTION 7 7. Which of the following statement is correct about the p-value of this hypothesis test? O cannot be determined. Op-value is less than the significance level. p-value is equal to the significance level. O p-value is greater than the significance level. QUESTION 8 8. Which of the following statement correctly describes the Type II error in this hypothesis test is correct? We mistakenly conclude that the filling accuracy is acceptable when it is indeed not acceptable We mistakenly conclude that the filling accuracy is not acceptable when it is indeed acceptable. We correctly conclude that the filling accuracy is acceptable. We correctly conclude that the filling accuracy is not acceptable. QUESTION 9 9. Suppose the critical value of sample mean you derived earlier is c. Which of the following R script can correctly compute the beta (probability of making type ll error)? 1- pnorm((c-6.3)/0.25) 1- pnorm((c-6.3)/2) pnorm((c-6.3)/2) O pnorm((c-6.3)/0.25) QUESTION 10 10. The probability of making Type II error in this hypothesis test is _.(round to the nearest thousandth) QUESTION 11 1 1. As the sample size increases, a decreases, Bincreases, and the p-value decreases. a does not change, B decreases, and the p-value increases. a does not change, B decreases, and the p-value decreases. O a decreases, B decreases, and the p-value increases.A production line operation is tested for filling weight accuracy using the following hypotheses. Ho: H 6 (filling error greater than 6. So, stop and adjust the production line) The sample size is 64; the sample mean is 6.3; the population standard deviation is 2; and the significance level is 0.01. 1. The standard error for this hypothesis test is _.(round to the nearest hundredth if necessary) QUESTION 2 2. Which of the following R script should be used to compute the critical value of the test statistic? O qt(0.995, 63) O qt(0.99, 63) O qnorm(0.99) O qnorm(0.995) QUESTION 3 3. The critical value of the test statistic is _. (round to the nearest hundredth if necessary) QUESTION 4 4. The critical value of the sample mean is _ _. (round to the nearest hundredth if necessary) QUESTION 5 5. Which of the following correctly describe the acceptance region for the null hypothesis? We accept the null hypothesis if the observed sample mean is between the negative and positive critical value of sample mean. We accept the null hypothesis if the observed sample mean is greater than the critical value of sample mean We accept the null hypothesis if the observed sample mean is less than the negative critical value of sample mean or greater than the positive critical value of sample mean . We accept the null hypothesis if the observed sample mean is less than the critical value of sample mean. QUESTION 6 6. Which of the following is the correct way to compute the p-value for this hypothesis test? O 1- phorm((6.3-6)/0.25) O pnorm((6.3-6)/2) O pnorm((6.3-6)/0.25)
Step by Step Solution
There are 3 Steps involved in it

Get step-by-step solutions from verified subject matter experts