

Question: Please answer the questions on the bottom by creating graphs and charts relating to this sample data. Thank you so much! 1. (4 pts) Construct
Please answer the questions on the bottom by creating graphs and charts relating to this sample data. Thank you so much!
1. (4 pts) Construct a figure using your picture of your gel. Annotate the gel by numbering the lanes, marking the ladder, and identifying/labeling sample bands on the sides of the gel. Be sure to also include an adequately detailed figure legend.
2. (4 pts) Calculate the Rf values of the bands in the molecular weight standard and the protein bands observed in one of the mixed protein sample lanes. Construct a table. For the bands from the standard (table 2), include: Rf, molecular weight (MW), and log (MW). For the bands from the mixed protein sample lane (table 3), include: Rf, calculated log (MW), calculated MW, visually estimated MW, and predicted band identity. You can present this data as two separate tables if you would like.
3. (4 pts) Create a figure (Figure 2) showing the relationship between the log (MW) of each standard and its corresponding Rf value, log (MW) vs. Rf (Rf on the x-axis). Also, create a figure (Figure 3) showing the relationship between the molecular weight of each standard and its corresponding Rf value, Rf vs. MW (Rf on the y-axis. Note that the axes are switched for these two plots). Both figures should be scatter plots with a trend line, equation, axis labels, and legend.
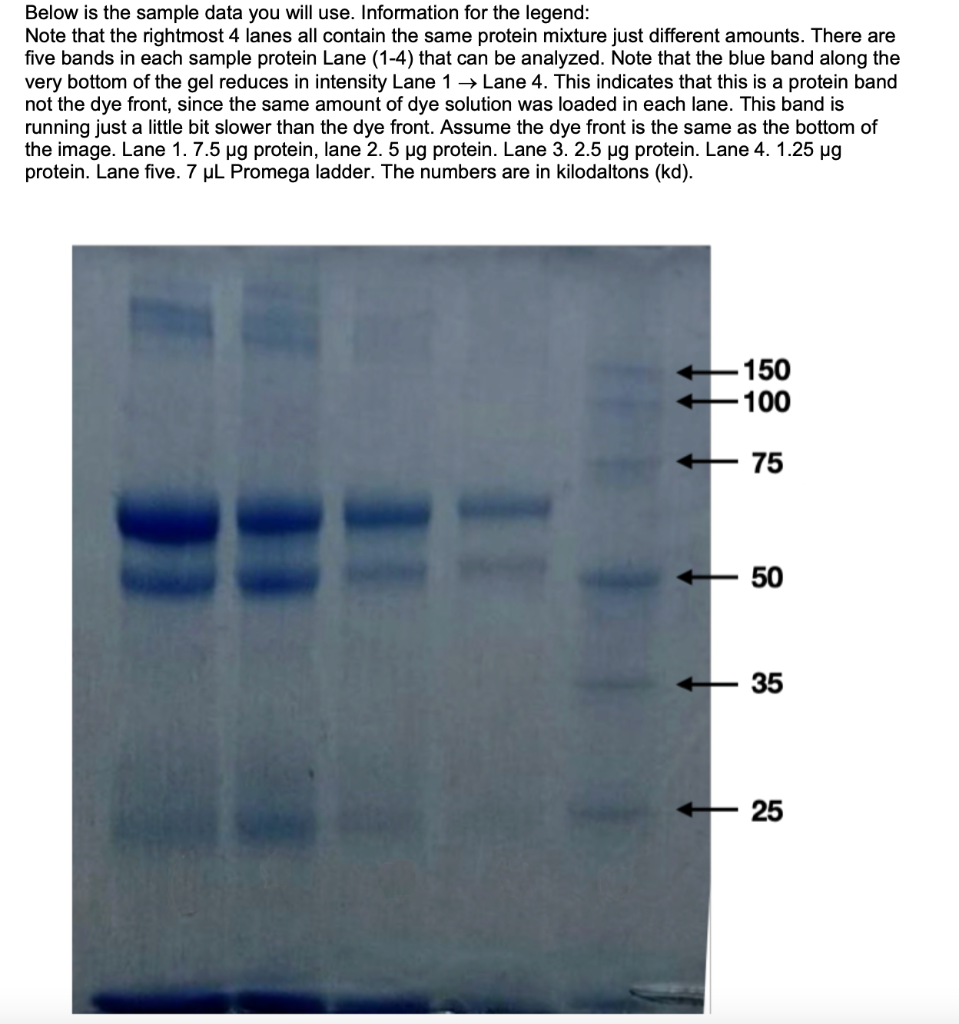
Below is the sample data you will use. Information for the legend: Note that the rightmost 4 lanes all contain the same protein mixture just different amounts. There are five bands in each sample protein Lane (1-4) that can be analyzed. Note that the blue band along the very bottom of the gel reduces in intensity Lane 1 Lane 4. This indicates that this is a protein band not the dye front, since the same amount of dye solution was loaded in each lane. This band is running just a little bit slower than the dye front. Assume the dye front is the same as the bottom of the image. Lane 1. 7.5 pg protein, lane 2. 5 ug protein. Lane 3. 2.5 ug protein. Lane 4. 1.25 ug protein. Lane five. 7 UL Promega ladder. The numbers are in kilodaltons (kd). - 150 -100 75 50 35 25
Step by Step Solution
There are 3 Steps involved in it

Get step-by-step solutions from verified subject matter experts