

Question: Please answer the questions using the information provided Cash Flows Balance Sheet Statement of Equity Income DOLLARAMA INC. Consolidated Statement of Financial Position as at
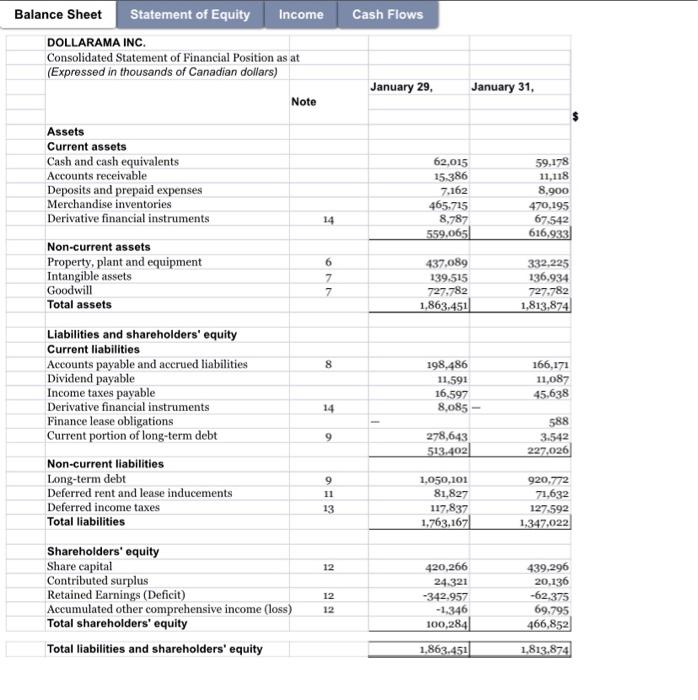
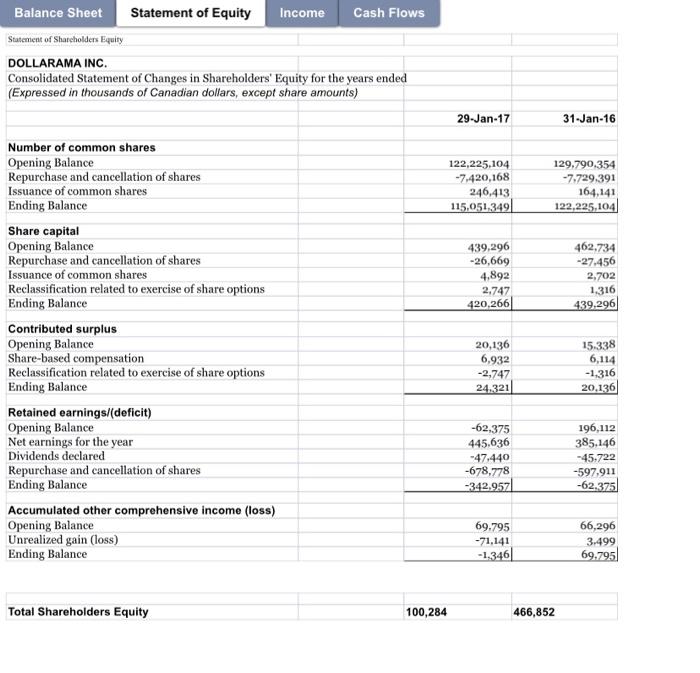
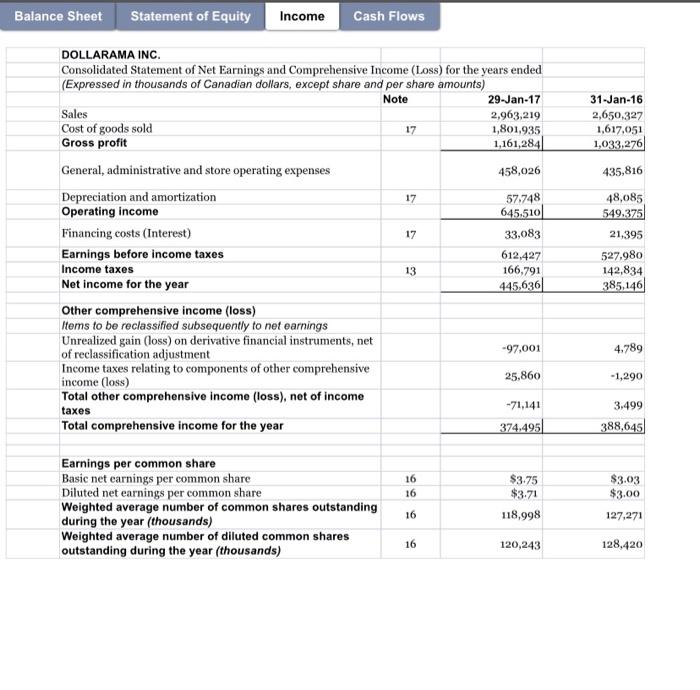
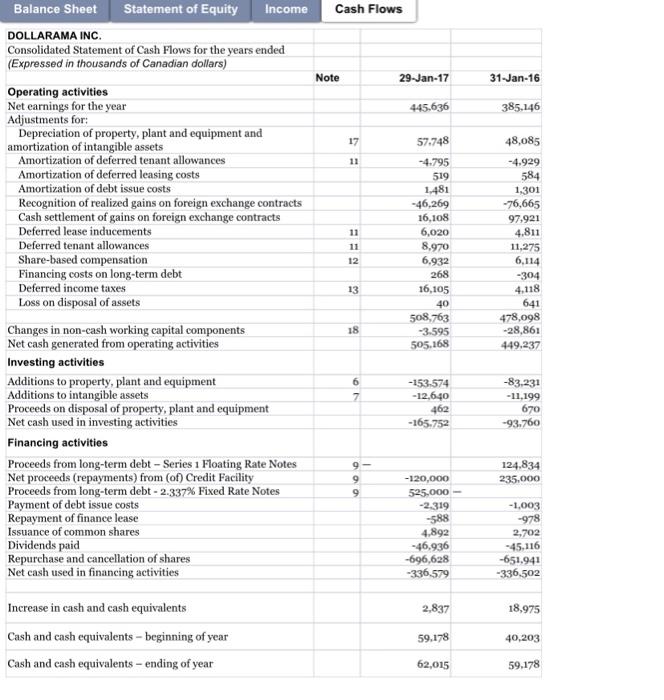
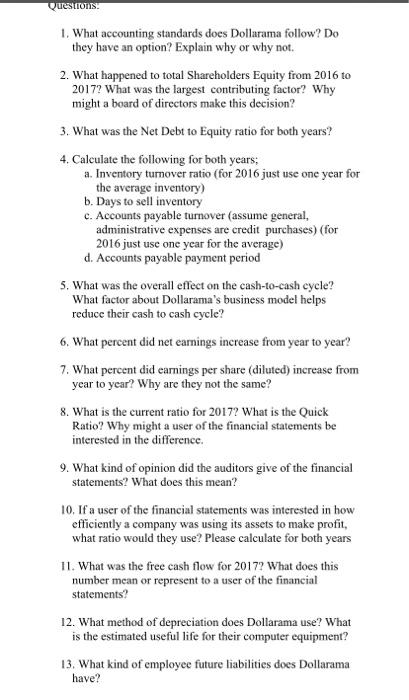
Cash Flows Balance Sheet Statement of Equity Income DOLLARAMA INC. Consolidated Statement of Financial Position as at (Expressed in thousands of Canadian dollars) January 29, January 31, Note Assets Current assets Cash and cash equivalents Accounts receivable Deposits and prepaid expenses Merchandise inventories Derivative financial instruments Non-current assets Property, plant and equipment Intangible assets Goodwill Total assets 62.015 15.386 7.162 465,715 8,787 559,065) 59.178 11,118 8,900 470.195 67.542 616,933 14 ONN 437,089 139.515 727.782 1,863.451 332,225 136.934 727.782 1,813,874 00 198,486 11.591 16.597 8,085 - 166,171 11,087 45,638 14 Liabilities and shareholders' equity Current liabilities Accounts payable and accrued liabilities Dividend payable Income taxes payable Derivative financial instruments Finance lease obligations Current portion of long-term debt Non-current liabilities Long-term debt Deferred rent and lease inducements Deferred income taxes Total liabilities 9 278,643 513.402 588 3.542 227,026 9 11 13 1,050,101 81.827 117,837 1.763,167 920,772 71,632 127.592 1,347,022 12 Shareholders' equity Share capital Contributed surplus Retained Earnings (Deficit) Accumulated other comprehensive income (loss) Total shareholders' equity Total liabilities and shareholders' equity 12 12 420 266 24.321 -342.957 -1.346 100,2841 439,296 20,136 -62.375 69.795 466,852 1.813.874 1,863.451 Balance Sheet Statement of Equity Income Cash Flows Statement of Shareholders Equity DOLLARAMA INC. Consolidated Statement of Changes in Shareholders' Equity for the years ended (Expressed in thousands of Canadian dollars, except share amounts) 29-Jan-17 31-Jan-16 122,225,104 -7.420,168 246,413 115,051,349 129.790.354 -7.729,391 164,141 122,225,104 439,296 -26,669 4,892 2.747 420,266 462.734 -27.456 2,702 1.316 439,296 Number of common shares Opening Balance Repurchase and cancellation of shares Issuance of common shares Ending Balance Share capital Opening Balance Repurchase and cancellation of shares Issuance of common shares Reclassification related to exercise of share options Ending Balance Contributed surplus Opening Balance Share-based compensation Reclassification related to exercise of share options Ending Balance Retained earnings/(deficit) Opening Balance Net earnings for the year Dividends declared Repurchase and cancellation of shares Ending Balance Accumulated other comprehensive income (loss) Opening Balance Unrealized gain (loss) Ending Balance 20,136 6,932 -2,747 24.321 15.338 6,114 -1,316 20,136 -62,375 445.636 -47.440 -678,778 -342.9571 196,112 385.146 -45,722 -597,911 -62.375 69.795 -71,141 -1.346 66,296 3.499 69.795 Total Shareholders Equity 100,284 466,852 Balance Sheet Statement of Equity Income Cash Flows 31-Jan-16 2,650.327 1,617,051 1,033.276 435,816 DOLLARAMA INC. Consolidated Statement of Net Earnings and Comprehensive Income (Loss) for the years ended (Expressed in thousands of Canadian dollars, except share and per share amounts) Note 29-Jan-17 Sales 2,963,219 Cost of goods sold 17 1,801,935 Gross profit 1,161,2841 General, administrative and store operating expenses 458,026 Depreciation and amortization 17 57.748 Operating income 645.510 Financing costs (Interest) 17 33,083 Earnings before income taxes 612,427 Income taxes 166,791 Net income for the year 445,636 Other comprehensive income (loss) Items to be reclassified subsequently to net earnings Unrealized gain (loss)on derivative financial instruments, net of reclassification adjustment -97,001 Income taxes relating to components of other comprehensive 25,860 income (loss) Total other comprehensive income (loss), net of income -71,141 taxes Total comprehensive income for the year 374.495 48,085 549.375 21,395 527.980 142,834 385,146 13 4.789 -1,290 3.499 388,645 16 16 Earnings per common share Basic net earnings per common share Diluted net earnings per common share Weighted average number of common shares outstanding during the year (thousands) Weighted average number of diluted common shares outstanding during the year (thousands) $3.75 $3.71 118,998 $3.03 $3.00 16 127,271 16 120,243 128,420 Cash Flows Note 29-Jan-17 31-Jan-16 445.636 385,146 17 48,085 11 11 11 12 Balance Sheet Statement of Equity Income DOLLARAMA INC. Consolidated Statement of Cash Flows for the years ended (Expressed in thousands of Canadian dollars) Operating activities Net earnings for the year Adjustments for: Depreciation of property, plant and equipment and amortization of intangible assets Amortization of deferred tenant allowances Amortization of deferred leasing costs Amortization of debt issue costs Recognition of realized gains on foreign exchange contracts Cash settlement of gains on foreign exchange contracts Deferred lease inducements Deferred tenant allowances Share-based compensation Financing costs on long-term debt Deferred income taxes Loss on disposal of assets Changes in non-cash working capital components Net cash generated from operating activities Investing activities Additions to property, plant and equipment Additions to intangible assets Proceeds on disposal of property, plant and equipment Net cash used in investing activities Financing activities Proceeds from long-term debt - Series 1 Floating Rate Notes Net proceeds (repayments) from (of) Credit Facility Proceeds from long-term debt - 2.337% Fixed Rate Notes Payment of debt issue costs Repayment of finance lease Issuance of common shares Dividends paid Repurchase and cancellation of shares Net cash used in financing activities 57.748 -4.795 519 1,481 -46,269 16,108 6,020 8,970 6,932 268 16,105 40 508,763 -3.595 505.168 -4.929 584 1,301 -76,665 97.921 4.811 11,275 6,114 -304 4.118 641 478,098 -28,861 449,237 13 18 6 7 -153.574 -12,640 462 -165.752 -83.231 -11,199 670 -93.760 9- 9 9 124.834 235,000 -120,000 525.000 -2.319 -588 4.892 -46,936 -696,628 -336.579 -1,003 -978 2,702 - 45.116 -651,941 -336.502 2.837 18,975 Increase in cash and cash equivalents Cash and cash equivalents - beginning of year Cash and cash equivalents - ending of year 59.178 40,203 62,015 59.178 Cash Flows Balance Sheet Statement of Equity Income DOLLARAMA INC. Consolidated Statement of Financial Position as at (Expressed in thousands of Canadian dollars) January 29, January 31, Note Assets Current assets Cash and cash equivalents Accounts receivable Deposits and prepaid expenses Merchandise inventories Derivative financial instruments Non-current assets Property, plant and equipment Intangible assets Goodwill Total assets 62.015 15.386 7.162 465,715 8,787 559,065) 59.178 11,118 8,900 470.195 67.542 616,933 14 ONN 437,089 139.515 727.782 1,863.451 332,225 136.934 727.782 1,813,874 00 198,486 11.591 16.597 8,085 - 166,171 11,087 45,638 14 Liabilities and shareholders' equity Current liabilities Accounts payable and accrued liabilities Dividend payable Income taxes payable Derivative financial instruments Finance lease obligations Current portion of long-term debt Non-current liabilities Long-term debt Deferred rent and lease inducements Deferred income taxes Total liabilities 9 278,643 513.402 588 3.542 227,026 9 11 13 1,050,101 81.827 117,837 1.763,167 920,772 71,632 127.592 1,347,022 12 Shareholders' equity Share capital Contributed surplus Retained Earnings (Deficit) Accumulated other comprehensive income (loss) Total shareholders' equity Total liabilities and shareholders' equity 12 12 420 266 24.321 -342.957 -1.346 100,2841 439,296 20,136 -62.375 69.795 466,852 1.813.874 1,863.451 Balance Sheet Statement of Equity Income Cash Flows Statement of Shareholders Equity DOLLARAMA INC. Consolidated Statement of Changes in Shareholders' Equity for the years ended (Expressed in thousands of Canadian dollars, except share amounts) 29-Jan-17 31-Jan-16 122,225,104 -7.420,168 246,413 115,051,349 129.790.354 -7.729,391 164,141 122,225,104 439,296 -26,669 4,892 2.747 420,266 462.734 -27.456 2,702 1.316 439,296 Number of common shares Opening Balance Repurchase and cancellation of shares Issuance of common shares Ending Balance Share capital Opening Balance Repurchase and cancellation of shares Issuance of common shares Reclassification related to exercise of share options Ending Balance Contributed surplus Opening Balance Share-based compensation Reclassification related to exercise of share options Ending Balance Retained earnings/(deficit) Opening Balance Net earnings for the year Dividends declared Repurchase and cancellation of shares Ending Balance Accumulated other comprehensive income (loss) Opening Balance Unrealized gain (loss) Ending Balance 20,136 6,932 -2,747 24.321 15.338 6,114 -1,316 20,136 -62,375 445.636 -47.440 -678,778 -342.9571 196,112 385.146 -45,722 -597,911 -62.375 69.795 -71,141 -1.346 66,296 3.499 69.795 Total Shareholders Equity 100,284 466,852 Balance Sheet Statement of Equity Income Cash Flows 31-Jan-16 2,650.327 1,617,051 1,033.276 435,816 DOLLARAMA INC. Consolidated Statement of Net Earnings and Comprehensive Income (Loss) for the years ended (Expressed in thousands of Canadian dollars, except share and per share amounts) Note 29-Jan-17 Sales 2,963,219 Cost of goods sold 17 1,801,935 Gross profit 1,161,2841 General, administrative and store operating expenses 458,026 Depreciation and amortization 17 57.748 Operating income 645.510 Financing costs (Interest) 17 33,083 Earnings before income taxes 612,427 Income taxes 166,791 Net income for the year 445,636 Other comprehensive income (loss) Items to be reclassified subsequently to net earnings Unrealized gain (loss)on derivative financial instruments, net of reclassification adjustment -97,001 Income taxes relating to components of other comprehensive 25,860 income (loss) Total other comprehensive income (loss), net of income -71,141 taxes Total comprehensive income for the year 374.495 48,085 549.375 21,395 527.980 142,834 385,146 13 4.789 -1,290 3.499 388,645 16 16 Earnings per common share Basic net earnings per common share Diluted net earnings per common share Weighted average number of common shares outstanding during the year (thousands) Weighted average number of diluted common shares outstanding during the year (thousands) $3.75 $3.71 118,998 $3.03 $3.00 16 127,271 16 120,243 128,420 Cash Flows Note 29-Jan-17 31-Jan-16 445.636 385,146 17 48,085 11 11 11 12 Balance Sheet Statement of Equity Income DOLLARAMA INC. Consolidated Statement of Cash Flows for the years ended (Expressed in thousands of Canadian dollars) Operating activities Net earnings for the year Adjustments for: Depreciation of property, plant and equipment and amortization of intangible assets Amortization of deferred tenant allowances Amortization of deferred leasing costs Amortization of debt issue costs Recognition of realized gains on foreign exchange contracts Cash settlement of gains on foreign exchange contracts Deferred lease inducements Deferred tenant allowances Share-based compensation Financing costs on long-term debt Deferred income taxes Loss on disposal of assets Changes in non-cash working capital components Net cash generated from operating activities Investing activities Additions to property, plant and equipment Additions to intangible assets Proceeds on disposal of property, plant and equipment Net cash used in investing activities Financing activities Proceeds from long-term debt - Series 1 Floating Rate Notes Net proceeds (repayments) from (of) Credit Facility Proceeds from long-term debt - 2.337% Fixed Rate Notes Payment of debt issue costs Repayment of finance lease Issuance of common shares Dividends paid Repurchase and cancellation of shares Net cash used in financing activities 57.748 -4.795 519 1,481 -46,269 16,108 6,020 8,970 6,932 268 16,105 40 508,763 -3.595 505.168 -4.929 584 1,301 -76,665 97.921 4.811 11,275 6,114 -304 4.118 641 478,098 -28,861 449,237 13 18 6 7 -153.574 -12,640 462 -165.752 -83.231 -11,199 670 -93.760 9- 9 9 124.834 235,000 -120,000 525.000 -2.319 -588 4.892 -46,936 -696,628 -336.579 -1,003 -978 2,702 - 45.116 -651,941 -336.502 2.837 18,975 Increase in cash and cash equivalents Cash and cash equivalents - beginning of year Cash and cash equivalents - ending of year 59.178 40,203 62,015 59.178
Step by Step Solution
There are 3 Steps involved in it

Get step-by-step solutions from verified subject matter experts