

Question: please answer the second question graph E5-3 The controller of Furgee Industries has collected the following monthly expense data for use in analyzing the cost
please answer the second question graph 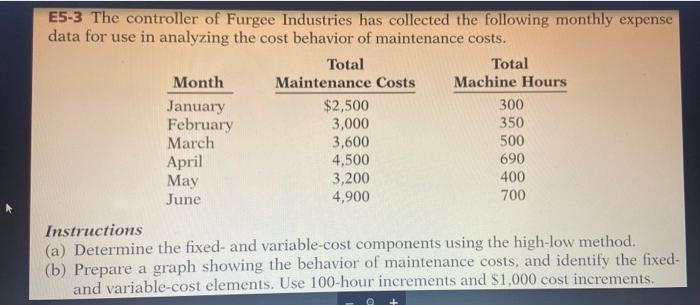
E5-3 The controller of Furgee Industries has collected the following monthly expense data for use in analyzing the cost behavior of maintenance costs. Total Total Month Maintenance Costs Machine Hours January $2,500 300 February 3,000 350 March 3,600 500 April 4,500 690 May 3,200 400 June 4,900 700 Instructions (a) Determine the fixed- and variable-cost components using the high-low method. (b) Prepare a graph showing the behavior of maintenance costs, and identify the fixed- and variable-cost elements. Use 100-hour increments and $1,000 cost increments
Step by Step Solution
There are 3 Steps involved in it
1 Expert Approved Answer
Step: 1 Unlock

Question Has Been Solved by an Expert!
Get step-by-step solutions from verified subject matter experts
Step: 2 Unlock
Step: 3 Unlock