

Question: Please answer these 2 questions . After completing and generating a scatter plot - standardize ormalize the data from the first question(#5 refers to the
Please answer these 2 questions. After completing and generating a scatter plot - standardize ormalize the data from the first question(#5 refers to the first part problem).
Please use python for solving the program and don't copy from another place. Also, please do not provide wrong /random solutions.
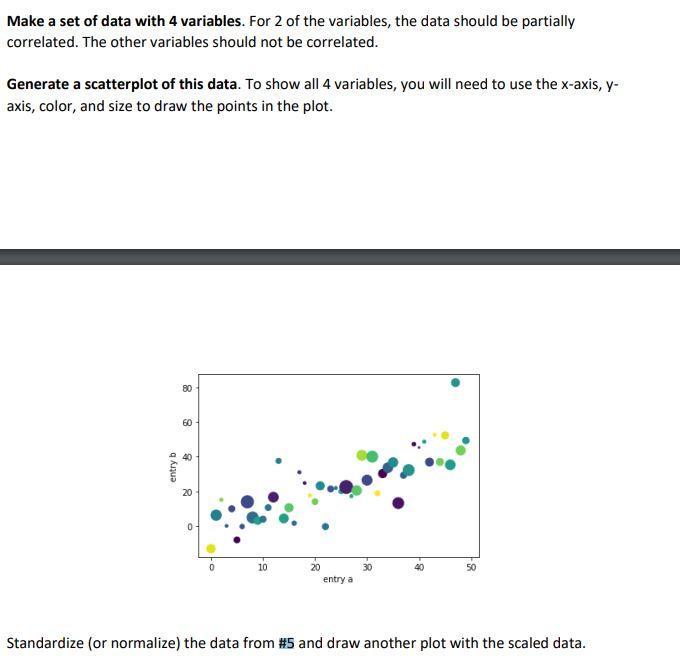
Make a set of data with 4 variables. For 2 of the variables, the data should be partially correlated. The other variables should not be correlated. Generate a scatterplot of this data. To show all 4 variables, you will need to use the x-axis, y- axis, color, and size to draw the points in the plot. 80 60 entry b 20 50 10 30 20 entry a Standardize (or normalize) the data from #5 and draw another plot with the scaled data
Step by Step Solution
There are 3 Steps involved in it

Get step-by-step solutions from verified subject matter experts