

Question: please answer these 3 multiple choice questions! there may be more than one answer in each question! thumbs up for answering all 3 questions :)))
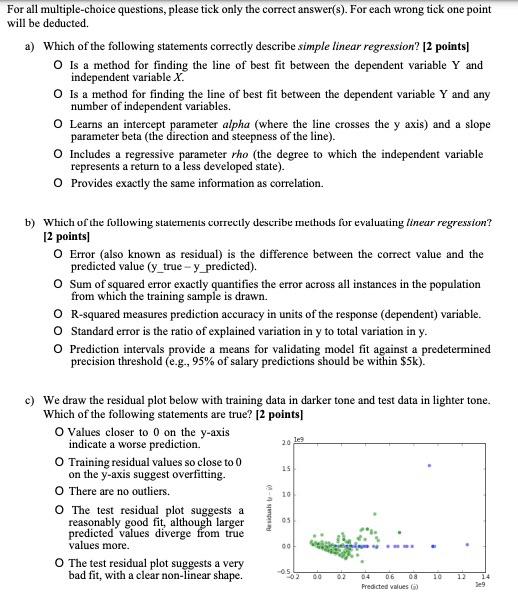
For all multiple-choice questions, please tick only the correct answer(s). For each wrong tick one point will be deducted. a) Which of the following statements correctly describe simple linear regression? [2 points] Is a method for finding the line of best fit between the dependent variable Y and independent variable X. Is a method for finding the line of best fit between the dependent variable Y and any number of independent variables. Learns an intercept parameter alpha (where the line crosses the y axis) and a slope parameter beta (the direction and steepness of the line). O Includes a regressive parameter rho (the degree to which the independent variable represents a return to a less developed state). Provides exactly the same information as correlation. b) Which of the following statements correctly describe methods for evaluating linear regression? [2 points] O Error (also known as residual) is the difference between the correct value and the predicted value (y_true - y predicted). O Sum of squared error exactly quantifies the error across all instances in the population from which the training sample is drawn. 0 R-squared measures prediction accuracy in units of the response (dependent) variable. O Standard error is the ratio of explained variation in y to total variation in y. Prediction intervals provide a means for validating model fit against a predetermined precision threshold (e.g., 95% of salary predictions should be within $5k ). c) We draw the residual plot below with training data in darker tone and test data in lighter tone. Which of the following statements are true? [2 points] O Values closer to 0 on the y-axis indicate a worse prediction. Training residual values so close to 0 on the y-axis suggest overfitting. There are no outliers. The test residual plot suggests a reasonably good fit, although larger predicted values diverge from true values more. O The test residual plot suggests a very bad fit, with a clear non-linear shape
Step by Step Solution
There are 3 Steps involved in it

Get step-by-step solutions from verified subject matter experts