

Question: Please answer these as soon as possible Using a series of nested for loops, compute the correlations between all possible pairs of ions separately for
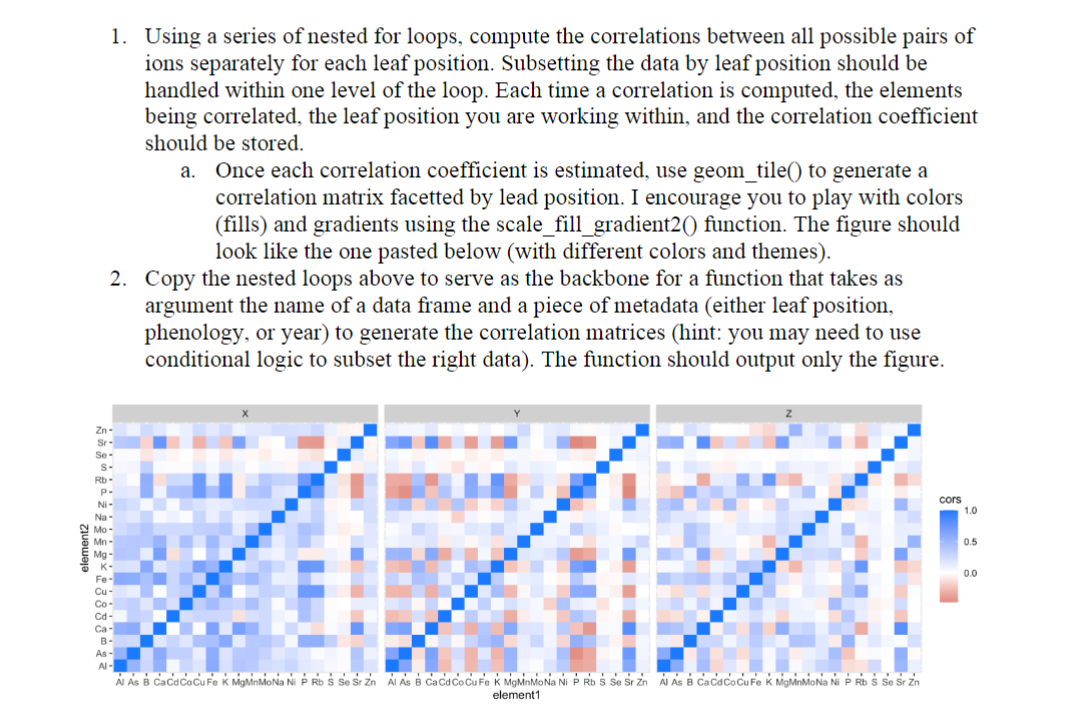
Please answer these as soon as possible Using a series of nested for loops, compute the correlations between all possible pairs of ions separately for each leaf position. Subsetting the data by leaf position should be handled within one level of the loop. Each time a correlation is computed, the elements being correlated, the leaf position you are working within, and the correlation coefficient should be stored.
a Once each correlation coefficient is estimated, use geomtile to generate a correlation matrix facetted by lead position. I encourage you to play with colors fills and gradients using the scalefillgradient function. The figure should look like the one pasted below with different colors and themes
Copy the nested loops above to serve as the backbone for a function that takes as argument the name of a data frame and a piece of metadata either leaf position, phenology, or year to generate the correlation matrices hint: you may need to use conditional logic to subset the right data The function should output only the figure.
give the r codes for these so that I would use the dataset required and change the names.
Step by Step Solution
There are 3 Steps involved in it
1 Expert Approved Answer
Step: 1 Unlock

Question Has Been Solved by an Expert!
Get step-by-step solutions from verified subject matter experts
Step: 2 Unlock
Step: 3 Unlock