

Question: please answer these MyLab and Mastering Chrome - Do Homework - Destiny Torres O X X -> C A Not set mathxl.com/Student/PlayerHomework.aspx?homeworkld=570024352&questionld=21&flushed=false&cld=6096669¢erwin=yes NEW = Math
please answer these
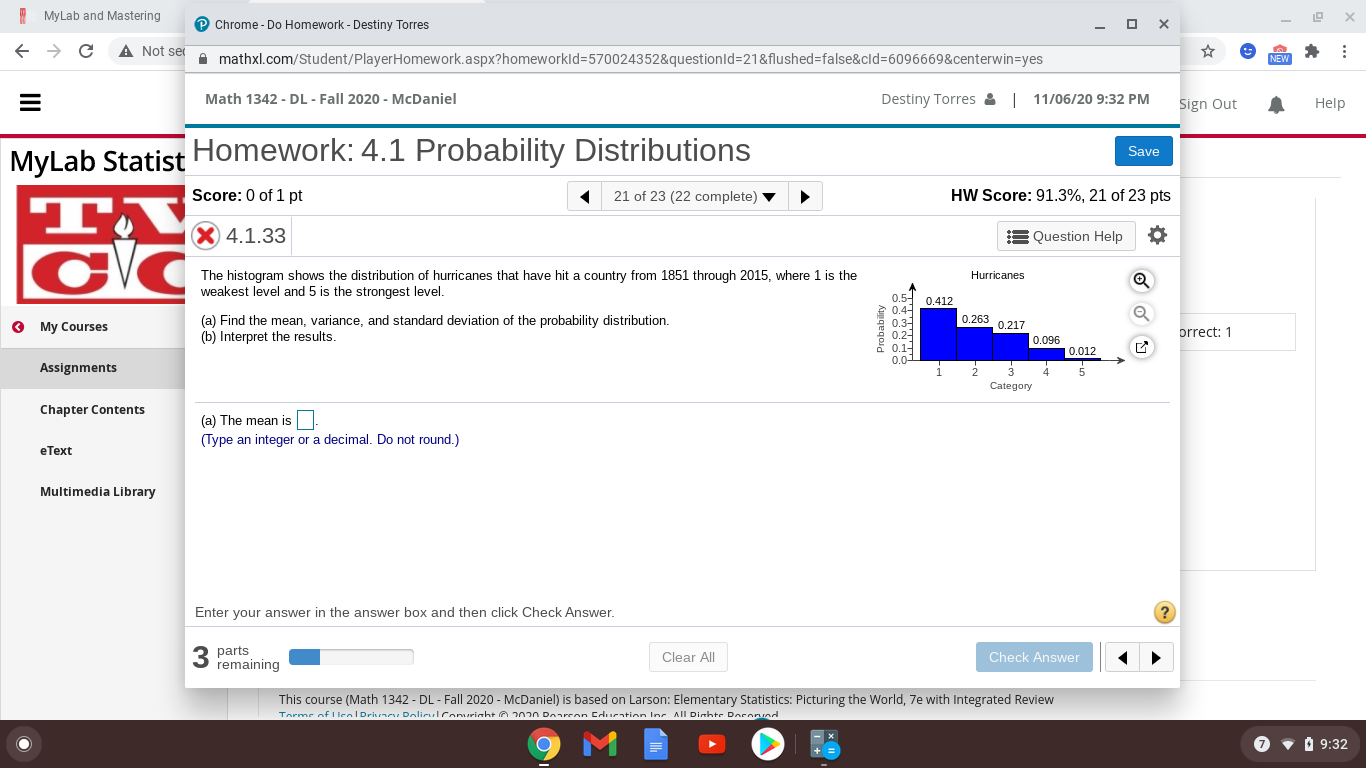
MyLab and Mastering Chrome - Do Homework - Destiny Torres O X X -> C A Not set mathxl.com/Student/PlayerHomework.aspx?homeworkld=570024352&questionld=21&flushed=false&cld=6096669¢erwin=yes NEW = Math 1342 - DL - Fall 2020 - McDaniel Destiny Torres & | 11/06/20 9:32 PM Sign Out Help MyLab Statist Homework: 4.1 Probability Distributions Save Score: 0 of 1 pt 21 of 23 (22 complete) HW Score: 91.3%, 21 of 23 pts X 4.1.33 Question Help The histogram shows the distribution of hurricanes that have hit a country from 1851 through 2015, where 1 is the Hurricanes weakest level and 5 is the strongest level. 0.57 0.412 My Courses (a) Find the mean, variance, and standard deviation of the probability distribution. Probability 0.263 0.217 (b) Interpret the results. 0.096 orrect: 1 0.012 Assignments 1 2 3 5 Category Chapter Contents (a) The mean is _. eText (Type an integer or a decimal. Do not round.) Multimedia Library Enter your answer in the answer box and then click Check Answer. ? 3 parts remaining Clear All Check Answer This course (Math 1342 - DL - Fall 2020 - McDaniel) is based on Larson: Elementary Statistics: Picturing the World, 7e with Integrated Review Torme of I leal Deismeu Dalicul Canuright (7 2070 Daarean Education Ine All Dighte Dacanund 7 9:32
Step by Step Solution
There are 3 Steps involved in it

Get step-by-step solutions from verified subject matter experts