

Question: PLEASE ANSWER THESE QUESTIONS ASAP! + Merge & Center $ . % ) 3 4 x fx Conditional Format Cell Formatting as Table Styles Symbol
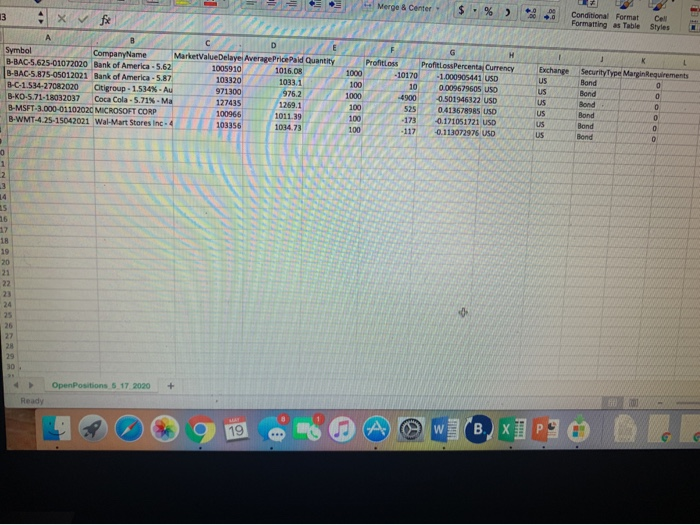
+ Merge & Center $ . % ) 3 4 x fx Conditional Format Cell Formatting as Table Styles Symbol Company Name MarketValueDelayel Average Price Pald Quantity B-BAC-5.625-01072020 Bank of America - 5.62 1005910 1016.08 B-BAC-5.875-05012021 Bank of America - 5.87 103320 1033.1 B-C-1.534-27082020 Citigroup - 1.534%. Au 971300 976.2 B-K0571-15032037 Coca Cola - 5.71% - Ma 127435 1269.1 B-MSFT-3.000-01102020 MICROSOFT CORP 100966 1011.39 B-WMT-4.25-15042021 Wal-Mart Stores Inc. 4 103356 1034.73 1000 100 1000 100 100 100 H ProfitLoss ProfitLoss Percenta Currency -10170 - 1.000905441 USD 10 0.009679605 USO 4900 -0.501946322 USD 525 0.413678985 USD -173 -0.171051721 USD -117 -0.113072976 USD Exchange US US US US Us US 1 K Security Type Margin Requirements Bond Bond 0 Bond O Bond 0 Bond 0 Bond 0 1 2 3 15 16 17 18 19 20 21 22 23 25 26 27 28 30 > Open Positions 5 17 2020 + Ready 19 9 W (.) X 2. Find the credit ratings for each of your companies, and enter that into Excel next to each corporate bond. Google will help you find this. 3. Do a Google search to find historical default rates and recoveries, by rating grade. Add this information to a new tab on your Excel workbook. Historical recovery rates will often be given by industry. Historical default rates are given by credit rating. 4. For each of your bonds, calculate expected default percent loss as Expected Loss-default probability*(1-recovery rate). You will need to use the default rates and recovery rates that match each bond's rating. 4. Calculate the overall expected loss to your portfolio as the weighted average of the expected default percent loss. Use the market value of each position as the weights in your weighted average
Step by Step Solution
There are 3 Steps involved in it

Get step-by-step solutions from verified subject matter experts