

Question: Please answer these questions based on the research question and calculations attached. Experiment: Is there a correlation between the average non-mortgage household debt (DV) and
Please answer these questions based on the research question and calculations attached.
Experiment: Is there a correlation between the average non-mortgage household debt (DV) and the average household income (IV)? Sample size (n) is 180.
- What is theNull & Alternate Hypothesis(set up using statistical symbols like =, , or ?.
- What is the p value (show work). Alpha is 0.5 with a confidence level of 95%
- What is the Test statistic (show work)
- What is the Statistical decision on the experiment? Is there is sufficient evidence?
- What additional variables can be used in a future experiment to change the business decision from #4?
- What is the business decision?
- If the sample size of 180 is used to represent the entire US population, what are the limitations of this?
- What are some suggestions on future research that relate to the research question (Is there a correlation between theaverage non-mortgage household debt(DV) and theaverage household income(IV)? Sample size (n) is 180.
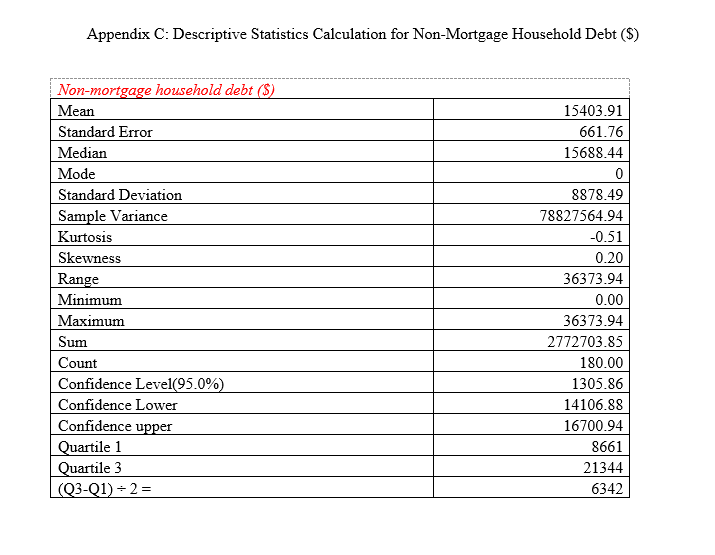
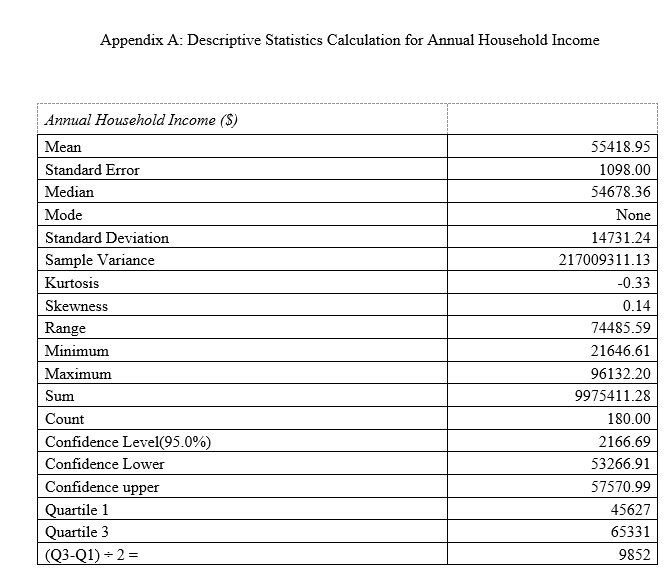
Appendix C: Descriptive Statistics Calculation for Non-Mortgage Household Debt ($) Non-mortgage household debt ($) Mean 15403.91 Standard Error 661.76 Median 15688.44 Mode Standard Deviation 8878.49 Sample Variance 78827564.94 Kurtosis -0.51 Skewness 0.20 Range 36373.94 Minimum 0.00 Maximum 36373.94 Sum 2772703.85 Count 180.00 Confidence Level(95.0%) 1305.86 Confidence Lower 14106.88 Confidence upper 16700.94 Quartile 1 8661 Quartile 3 21344 (Q3-Q1) = 2 = 6342Appendix A: Descriptive Statistics Calculation for Annual Household Income Annual Household Income ($) Mean 55418.95 Standard Error 1098.00 Median 54678.36 Mode None Standard Deviation 14731.24 Sample Variance 217009311.13 Kurtosis -0.33 Skewness 0.14 Range 74485.59 Minimum 21646.61 Maximum 96132.20 Sum 9975411.28 Count 180.00 Confidence Level(95.0%) 2166.69 Confidence Lower 53266.91 Confidence upper 57570.99 Quartile 1 45627 Quartile 3 65331 (Q3-Q1) +2 = 9852
Step by Step Solution
There are 3 Steps involved in it

Get step-by-step solutions from verified subject matter experts