

Question: Please answer these two questions based on the graph attached 19. Calculate the average (expected value) use of vehicle?A) .56. B) 5.84. C) 6.25. D)

Please answer these two questions based on the graph attached 19. Calculate the average (expected value) use of vehicle?A) .56. B) 5.84. C) 6.25. D) 720) What is the most frequently occurring value in the data set?A) p(x)=0.57. B) x=7. C) p(x)=0. D) x=0 and x=1
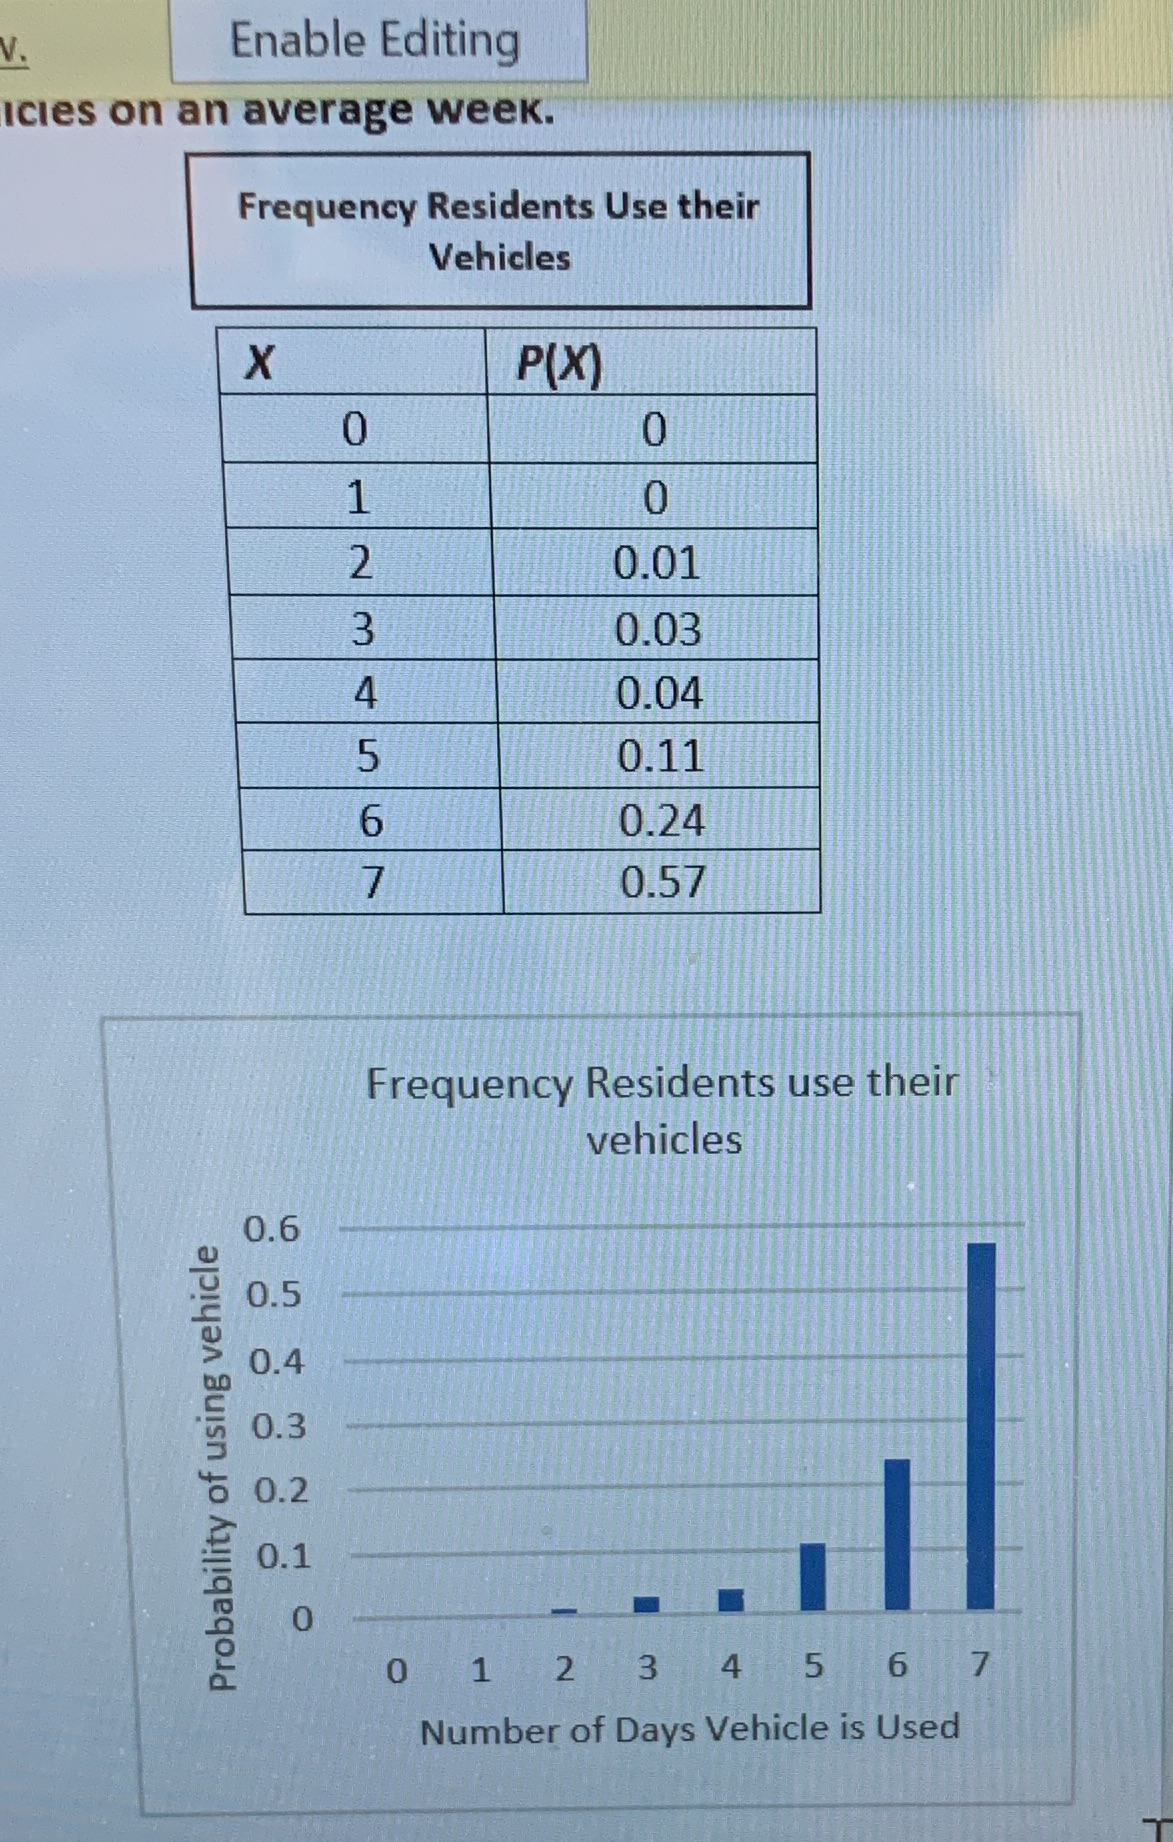
V. Enable Editing icles on an average week. Frequency Residents Use their Vehicles X P(X) 0 0 0 2 0.01 0.03 0.04 0.11 0.24 0.57 Frequency Residents use their vehicles Probability of using vehicle 0 1 2 3 4 5 6 7 Number of Days Vehicle is Used
Step by Step Solution
There are 3 Steps involved in it
1 Expert Approved Answer
Step: 1 Unlock

Question Has Been Solved by an Expert!
Get step-by-step solutions from verified subject matter experts
Step: 2 Unlock
Step: 3 Unlock