

Question: please answer this and put some solution.This topic is Illustrating Normal Random Variable And ItsCharacteristics ACTIVITY 1: CONSTRUCT ME! Given the following score distributions of
please answer this and put some solution.This topic is "Illustrating Normal Random Variable And ItsCharacteristics"
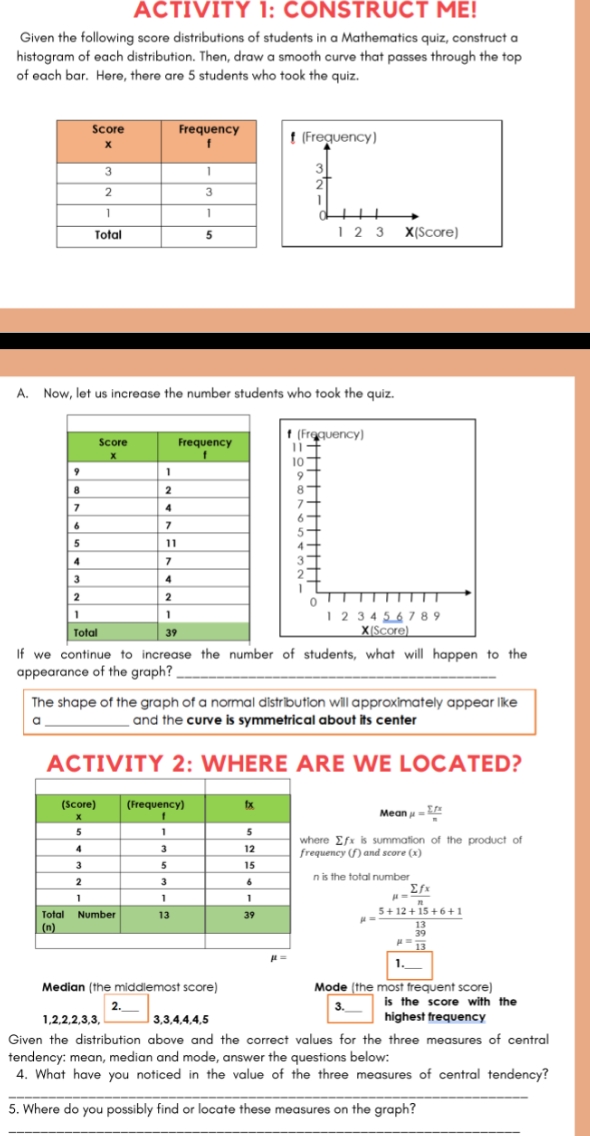
ACTIVITY 1: CONSTRUCT ME! Given the following score distributions of students in a Mathematics quiz, construct a histogram of each distribution. Then, draw a smooth curve that passes through the top of each bar. Here, there are 5 students who took the quiz. Score Frequency X (Frequency) 3 2 1 Total 5 1 2 3 X(Score) A. Now, let us increase the number students who took the quiz. f (Frequency) Score Frequency 11 10 1 2 4 7 11 7 N A 2 0 TITTTTT 1 2 3 4 5 6 7 8 9 Total 39 X[Score) If we continue to increase the number of students, what will happen to the appearance of the graph? The shape of the graph of a normal distribution will approximately appear like a and the curve is symmetrical about its center ACTIVITY 2: WHERE ARE WE LOCATED? (score) (Frequency) Ex Mean H - En 5 1 5 where Efx is summation of the product of 3 12 frequency (f) and score (x) 3 5 15 3 n is the total number 1 1 1 - 2fx Total Number 13 39 5+ 12 + 15 +6+1 (n) 13 13 N = Median (the middlemost score) Mode (the most frequent score) 2. 3. is the score with the 1,2,2,2,3,3, 3,3,4,4,4,5 highest frequency Given the distribution above and the correct values for the three measures of central tendency: mean, median and mode, answer the questions below: 4. What have you noticed in the value of the three measures of central tendency? 5. Where do you possibly find or locate these measures on the graph
Step by Step Solution
There are 3 Steps involved in it

Get step-by-step solutions from verified subject matter experts