

Question: please answer this In a study about food security status in families in the Appalachian region of southern Ohio, USA, participants were asked how many
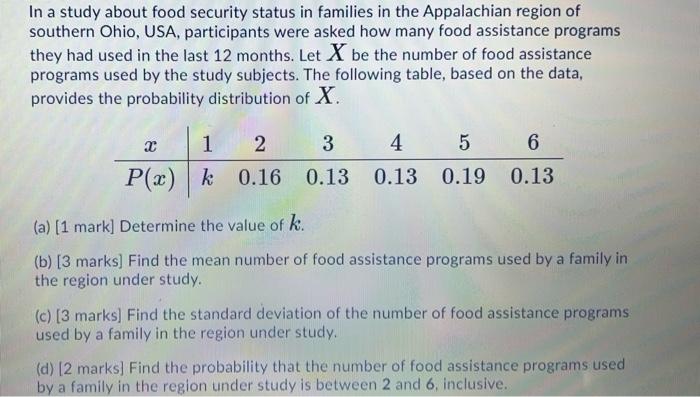
In a study about food security status in families in the Appalachian region of southern Ohio, USA, participants were asked how many food assistance programs they had used in the last 12 months. Let X be the number of food assistance programs used by the study subjects. The following table, based on the data, provides the probability distribution of X. 2 1 2 P(x) k k 0.16 3 4 5 6 0.13 0.13 0.19 0.13 (a) (1 mark] Determine the value of k. (b) [3 marks) Find the mean number of food assistance programs used by a family in the region under study. (c) [3 marks) Find the standard deviation of the number of food assistance programs used by a family in the region under study. (d) [2 marks) Find the probability that the number of food assistance programs used by a family in the region under study is between 2 and 6, inclusive
Step by Step Solution
There are 3 Steps involved in it

Get step-by-step solutions from verified subject matter experts