

Question: Please answer this question A random sample of 160 car accidents are selected and categorized by the age of the driver determined to be at
Please answer this question
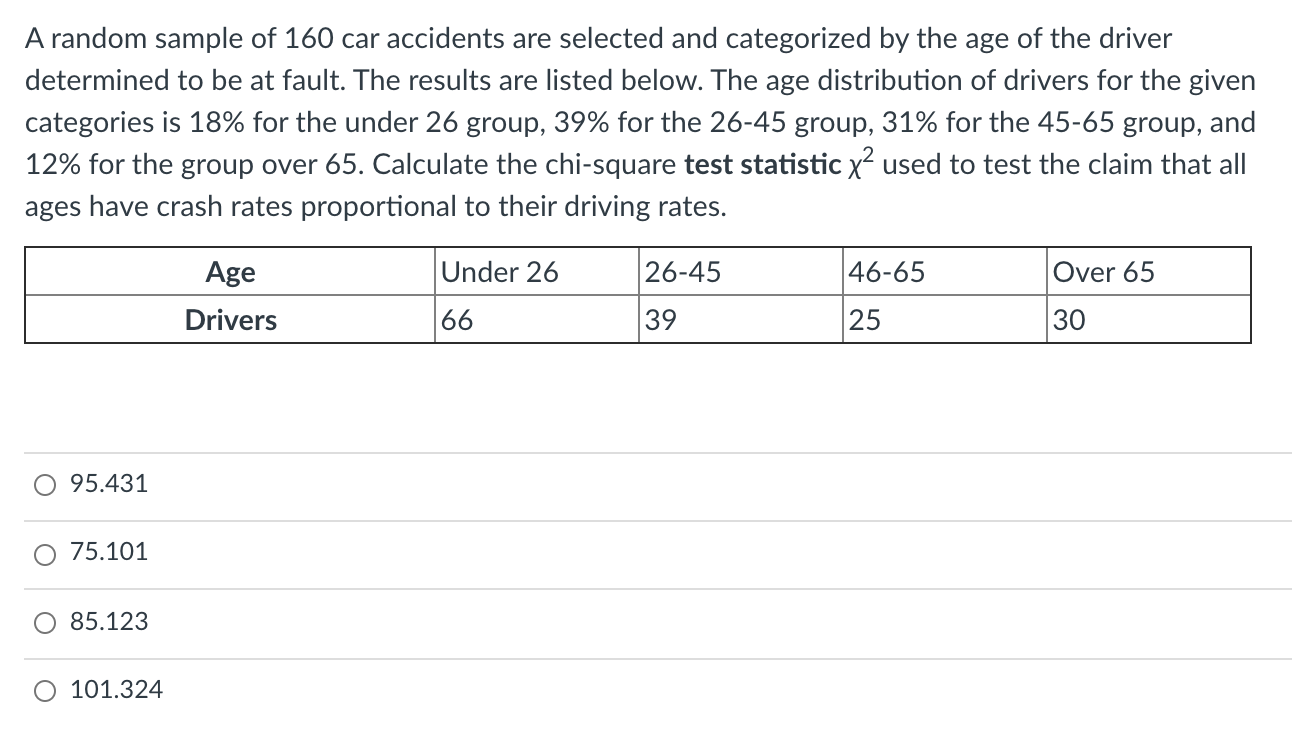
A random sample of 160 car accidents are selected and categorized by the age of the driver determined to be at fault. The results are listed below. The age distribution of drivers for the given categories is 18% for the under 26 group, 39% for the 26-45 group, 31% for the 45-65 group, and 12% for the group over 65. Calculate the chi-square test statistic x2 used to test the claim that all ages have crash rates proportional to their driving rates. _ 0 95.431 0 75.101 0 85.123 0 101.324
Step by Step Solution
There are 3 Steps involved in it
1 Expert Approved Answer
Step: 1 Unlock

Question Has Been Solved by an Expert!
Get step-by-step solutions from verified subject matter experts
Step: 2 Unlock
Step: 3 Unlock