

Question: Please answer this question ASAP. & provide the correct function and formula to use. N 0 P Q R Solution Team Washington Statistic Away Average
Please answer this question ASAP. & provide the correct function and formula 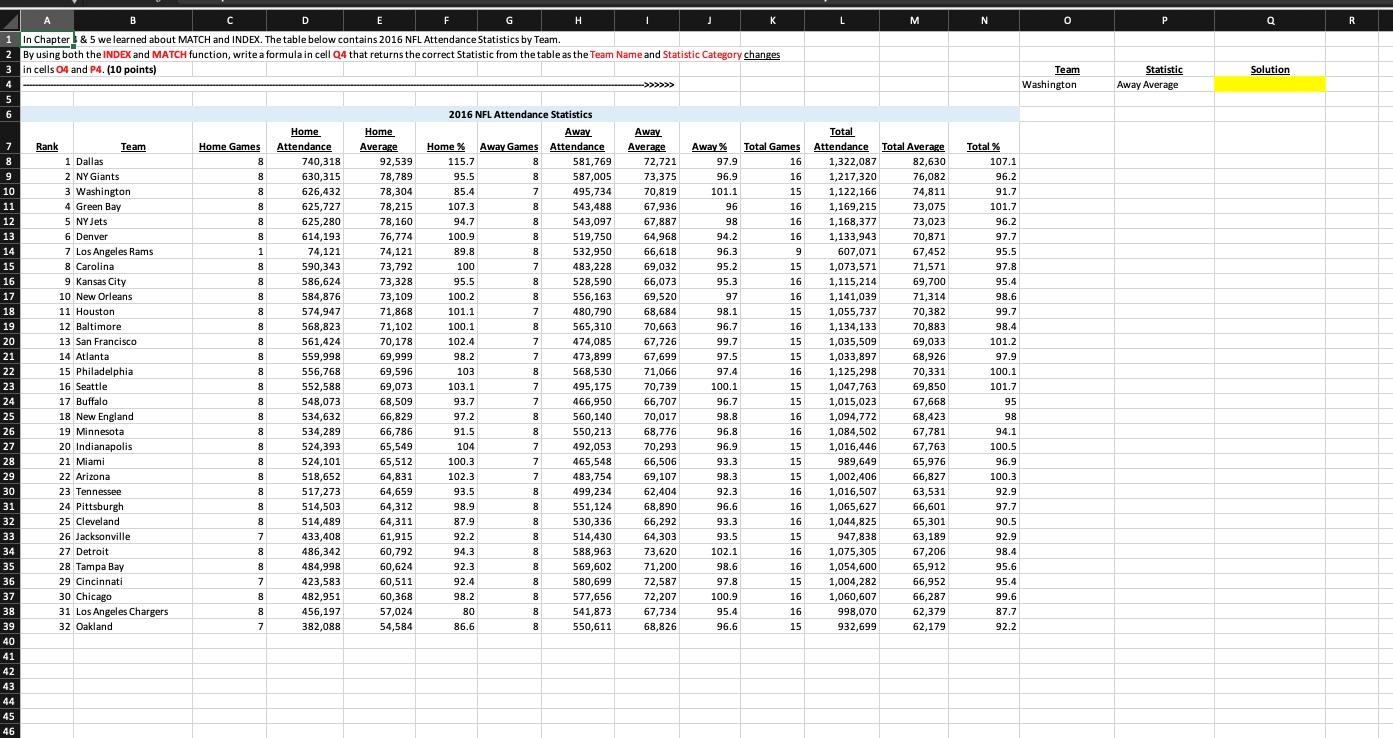 to use.
N 0 P Q R Solution Team Washington Statistic Away Average 74,811 C D E F H 1 K L M 1 In Chapter & 5 we learned about MATCH and INDEX. The table below contains 2016 NFL Attendance Statistics by Team. 2 By using both the INDEX and MATCH function, write a formula in cell Q4 that returns the correct Statistic from the table as the Team Name and Statistic Category changes in cells 04 and P4. (10 points) >>>>> 5 6 2016 NFL Attendance Statistics Home Home Away Away Total 7 Rank Team Home Games Attendance Average Home % Away Games Attendance Average Away % Total Games Attendance Total Average 8 1 Dallas 8 740,318 92,539 115.7 8 581,769 72,721 97.9 16 1,322,087 82,630 9 2 NY Giants 8 630,315 78,789 95.5 8 587,005 73,375 96.9 16 1,217,320 76,082 10 3 Washington 8 626,432 78,304 85.4 7 495,734 70,819 101.1 15 1,122,166 11 4 Green Bay 8 625,727 78,215 107.3 8 543,488 67,936 96 16 12 1,169,215 73,075 5 NY Jets 8 625,280 78,160 94.7 8 543,097 67,887 98 16 1,168,377 73,023 13 6 Denver 8 614,193 76,774 100.9 8 519,750 64,968 94.2 16 1,133,943 70,871 14 7 Los Angeles Rams 1 74,121 74,121 89.8 8 532,950 66,618 96.3 9 607,071 67,452 15 8 Carolina 8 590,343 73,792 100 7 483,228 69,032 95.2 15 71,571 16 1,073,571 9 Kansas City 8 586,624 73,328 95.5 8 528,590 66,073 95.3 16 1,115,214 69,700 17 10 New Orleans 8 584,876 73,109 100.2 8 556,163 69,520 97 16 1,141,039 71,314 18 11 Houston 8 574,947 71,868 101.1 7 480,790 68,684 98.1 15 1,055,737 19 70,382 12 Baltimore 8 568.823 71,102 100.1 8 565,310 70,663 96.7 16 1,134,133 70,883 20 13 San Francisco 8 561,424 70,178 102.4 7 474,085 67,726 99.7 15 1,035,509 69,033 21 14 Atlanta 8 559,998 69,999 98.2 7 473,899 67,699 97.5 15 1,033,897 68,926 22 15 Philadelphia 8 556,768 69,596 103 8 568,530 71,066 97.4 16 1,125,298 70,331 23 16 Seattle 8 552,588 69,073 103.1 7 495,175 70,739 100.1 15 1,047,763 69,850 24 17 Buffalo 8 548,073 68,509 93.7 7 7 466,950 66,707 96.7 15 1,015,023 25 67,668 18 New England 8 534,632 66,829 97.2 8 560,140 70,017 98.8 16 1,094,772 68,423 26 19 Minnesota 8 534,289 66,786 91.5 8 550,213 68,776 96.8 16 1,084,502 67,781 27 20 Indianapolis 8 524,393 65,549 104 7 492,053 70,293 96.9 15 1,016,446 28 67,763 21 Miami 8 524,101 65,512 100.3 7 465,548 66,506 93.3 15 989,649 65,976 29 22 Arizona 8 518,652 64,831 102.3 7 483,754 69,107 98.3 15 30 1,002,406 66,827 23 Tennessee 8 517,273 64,659 93.5 8 499,234 62,404 92.3 16 1,016,507 24 Pittsburgh 63,531 31 8 514,503 64,312 98.9 8 551,124 68,890 96.6 16 1,065,627 66,60 32 25 Cleveland 8 514,489 64,311 87.9 8 530,336 66,292 93.3 16 1,044,825 33 65,30 26 Jacksonville 7 433,408 61,915 92.2 8 514,430 64,303 93.5 15 947,838 63,189 34 27 Detroit 8 486,342 60,792 94.3 8 588,963 73,620 102.1 16 1,075,305 67,206 35 28 Tampa Bay 8 484,998 60,624 92.3 8 569,602 71,200 98.6 16 1,054,600 36 29 Cincinnati 65,912 7 423,583 60,511 92.4 8 580,699 72,587 97.8 15 1,004,282 66,952 37 30 Chicago 8 482,951 60,368 98.2 8 577,656 72,207 100.9 16 1,060,607 66,287 38 31 Los Angeles Chargers 8 456,197 57,024 80 8 541,873 67,734 95.4 16 998,070 62,379 39 32 Oakland 7 382,088 54,584 86.6 8 550,611 68,826 96.6 15 932,699 62,179 40 41 42 43 44 45 46 Total % 107.1 96.2 91.7 101.7 96.2 97.7 95.5 97.8 95.4 98.6 99.7 98.4 101.2 97.9 100.1 101.7 95 98 94.1 100.5 96.9 100.3 92.9 97.7 90.5 92.9 98.4 95.6 95.4 99.6 87.7 92.2
Step by Step Solution
There are 3 Steps involved in it

Get step-by-step solutions from verified subject matter experts