

Question: Please answer this question Consider the following graph, which represents the paper market: Price {$3 500 M58 supply == MC 400 30 200 100 Demand
Please answer this question
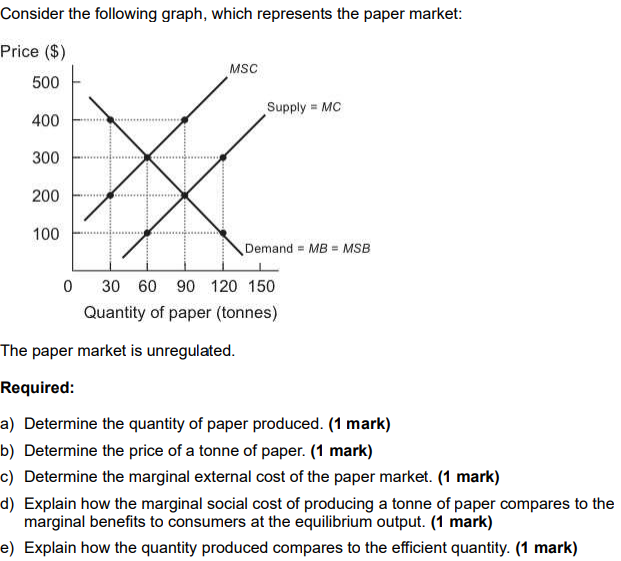
Consider the following graph, which represents the paper market: Price {$3 500 M58 supply == MC 400 30 200 100 Demand = are = use D 30 ED 9D 12D 151:]I Quantity of paper (tonnes) The paper market is unregulated. Required: a} Determine the quantity of paper produced. {"I mark] h} Determine the price of a tonne of paper. {1 mark] c] Determine the marginal external cost of the paper market. {'1 mark] d} Explain how the marginal social cost of producing a tonne of paper compares to the marginal benets to consumers at the equilibrium output. ('1 mark] e} Explain how the quantity produced compares to the efcient quantity. [1 mark]
Step by Step Solution
There are 3 Steps involved in it

Get step-by-step solutions from verified subject matter experts