

Question: Please answer this question entirely. This problem involves multiple pictures. This includes two parts to the problem a & b; the problem isn't long just
Please answer this question entirely. This problem involves multiple pictures. This includes two parts to the problem a & b; the problem isn't long just a lot of information. Thank you. 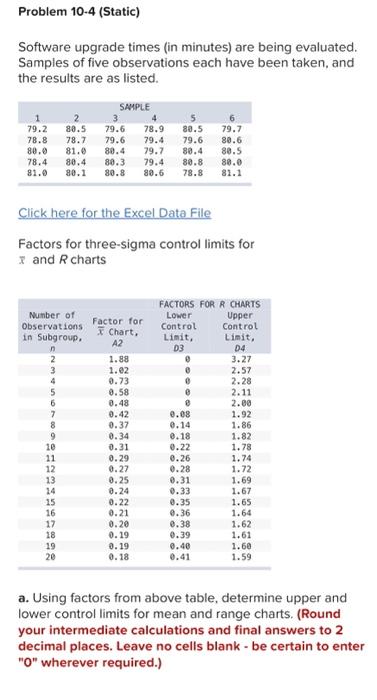
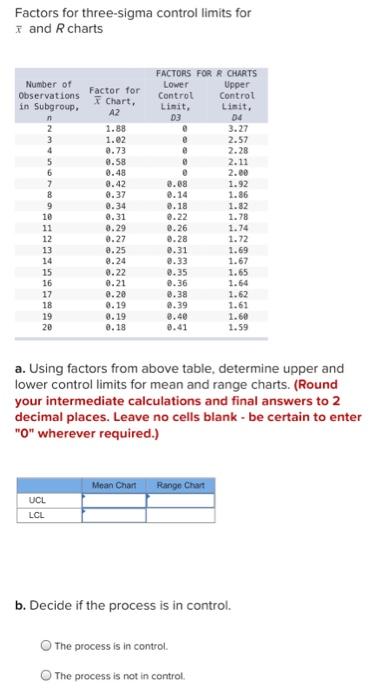
Problem 10-4 (Static) Software upgrade times (in minutes) are being evaluated. Samples of five observations each have been taken, and the results are as listed. 1 79.2 78.8 80. 78.4 81.0 2 80.5 78.7 81. 80.4 80.2 SAMPLE 3 4 79.6 78.9 79.6 79.4 80.4 79.7 80.3 79.4 80.8 80.6 5 88.5 79.6 80.4 80.8 78.8 79.7 80.6 80.5 88.0 81.1 Click here for the Excel Data File Factors for three-sigma control limits for and R charts Number of Observations in Subgroup. 4 5 6 7 8 9 10 11 12 13 14 15 16 17 18 19 20 Factor for Chart, A2 1.88 1.02 0.73 0.58 0.48 0.42 0.37 0.34 0.31 0.29 0.27 0.25 0.24 0.22 0.21 0.20 0.19 0.19 0.18 FACTORS FOR R CHARTS Lower Upper Control Control Limit, Limit, D3 04 3.27 0 2.57 0 2.28 2.11 2.00 0.08 1.92 0.14 1.86 0.18 1.82 0.22 1.78 0.26 1.74 0.28 1.72 0.31 1.69 0.33 1.67 0.35 1.65 0.36 1.64 0.38 1.62 0.39 1.61 0.40 1.60 0.41 1.59 a. Using factors from above table, determine upper and lower control limits for mean and range charts, (Round your intermediate calculations and final answers to 2 decimal places. Leave no cells blank - be certain to enter "0" wherever required.) Factors for three-sigma control limits for I and R charts Factor for Chart, A2 2.57 Number of Observations in Subgroup n 2 3 4 5 6 7 8 9 10 11 12 13 14 15 16 17 18 19 20 1.88 1.02 2.73 0.58 0.48 8.42 @.37 0.34 2.31 0.29 0.22 2.25 8.24 0.22 0.21 0.20 0.19 0.19 0.18 FACTORS FOR R CHARTS Lower Upper Control Control Linit, Lisit, D3 D4 3.27 e e 2.28 0 2.11 2.60 2.08 1.92 0.14 1.86 0.18 1.82 0.22 1.78 0.26 1.74 0.28 1.72 0.31 1.69 0.33 1.67 0.35 1.65 8.36 1.64 0.38 1.62 @.39 1.61 8.40 1.60 0.41 1.59 a. Using factors from above table, determine upper and lower control limits for mean and range charts. (Round your intermediate calculations and final answers to 2 decimal places. Leave no cells blank - be certain to enter "0" wherever required.) Mean Chant Range Chart UCL LCL b. Decide if the process is in control. The process is in control. The process is not in control Step by Step Solution
There are 3 Steps involved in it
1 Expert Approved Answer
Step: 1 Unlock

Question Has Been Solved by an Expert!
Get step-by-step solutions from verified subject matter experts
Step: 2 Unlock
Step: 3 Unlock