

Question: Please Answer this question Figure 2 shows the aggregate demand ! aggregate suppl'glr model. a} label the three curves that are shown here { AB.

Please Answer this question
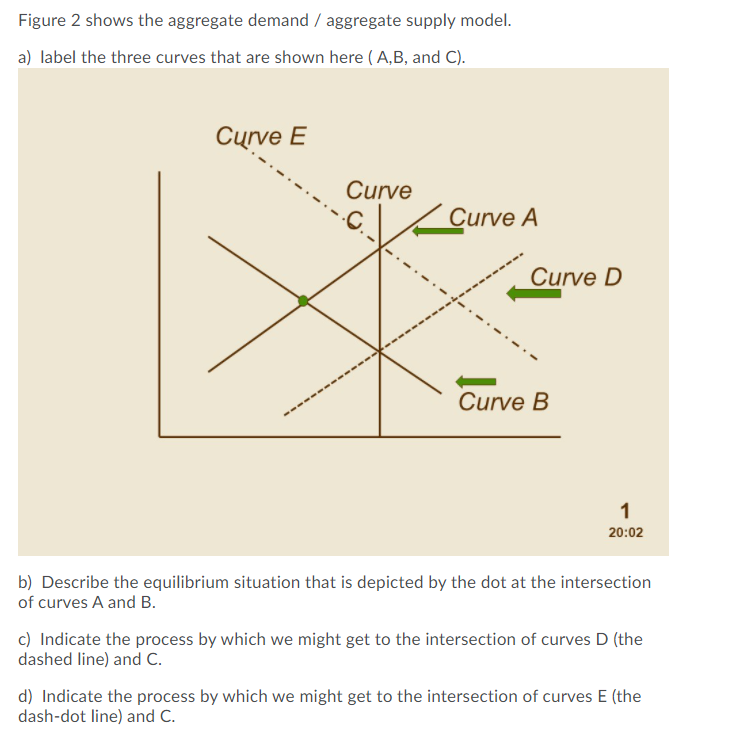
Figure 2 shows the aggregate demand ! aggregate suppl'glr model. a} label the three curves that are shown here { AB. and C]. b} Describe the equilibrium situation that is depicted by the dot at the intersection of curves A and B. c] Indicate the process by which we might get to the intersection of curves D [the dashed line} and C. d] Indicate the process by which we might get to the intersection of curves E {the dash-dot line] and C
Step by Step Solution
There are 3 Steps involved in it
1 Expert Approved Answer
Step: 1 Unlock

Question Has Been Solved by an Expert!
Get step-by-step solutions from verified subject matter experts
Step: 2 Unlock
Step: 3 Unlock