

Question: Please answer this question or connect with me personally with it in case the time runs out - d e s a i a a
Please answer this question or connect with me personally with it in case the time runs out - d e s a i a a s h i 1 9 9 9 @ g m a i l . c o m
Conduct the attached One Way Anova Test on the relationship between schools' poverty level and performance on the keystone math test by using the data provided to you from the Pennsylvania Department of Education.
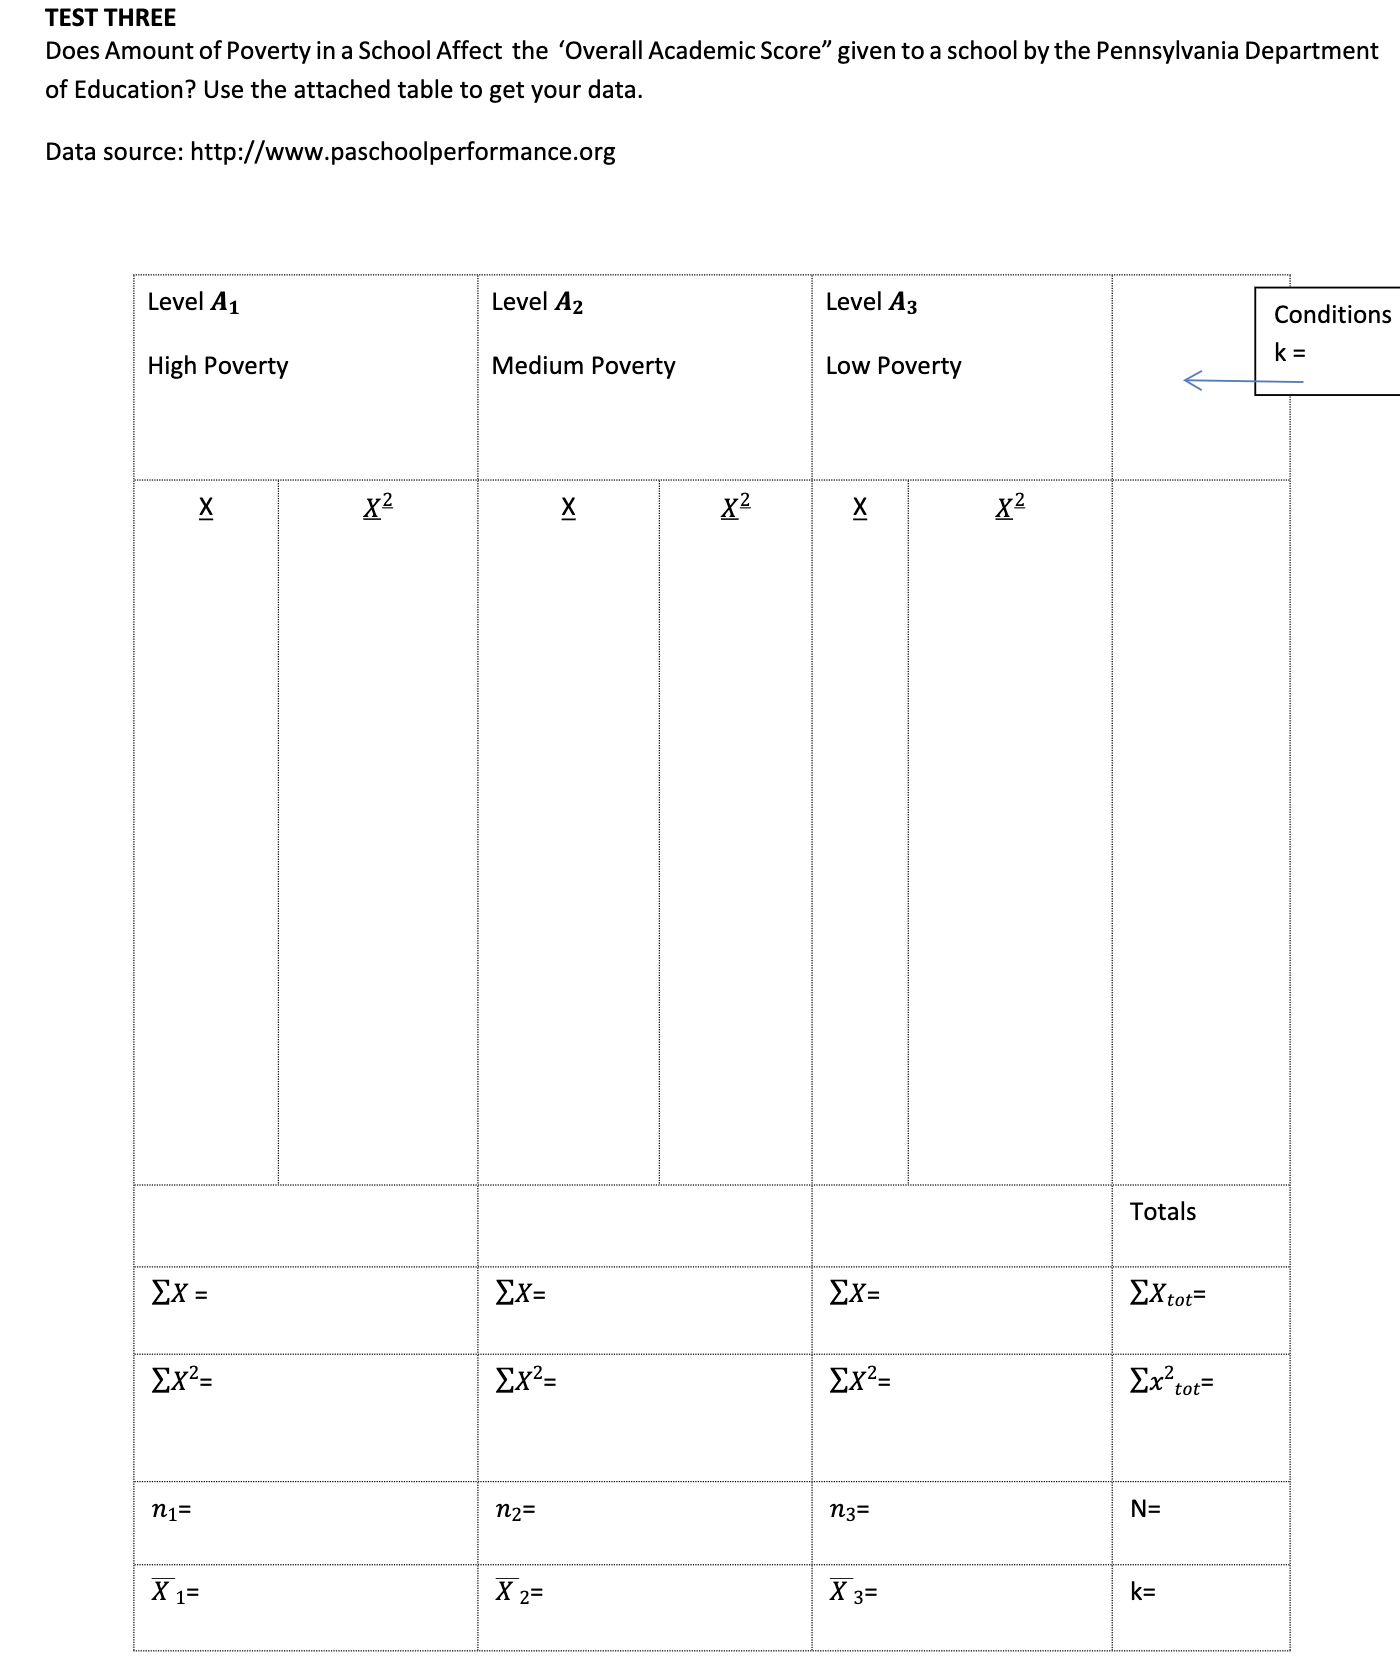
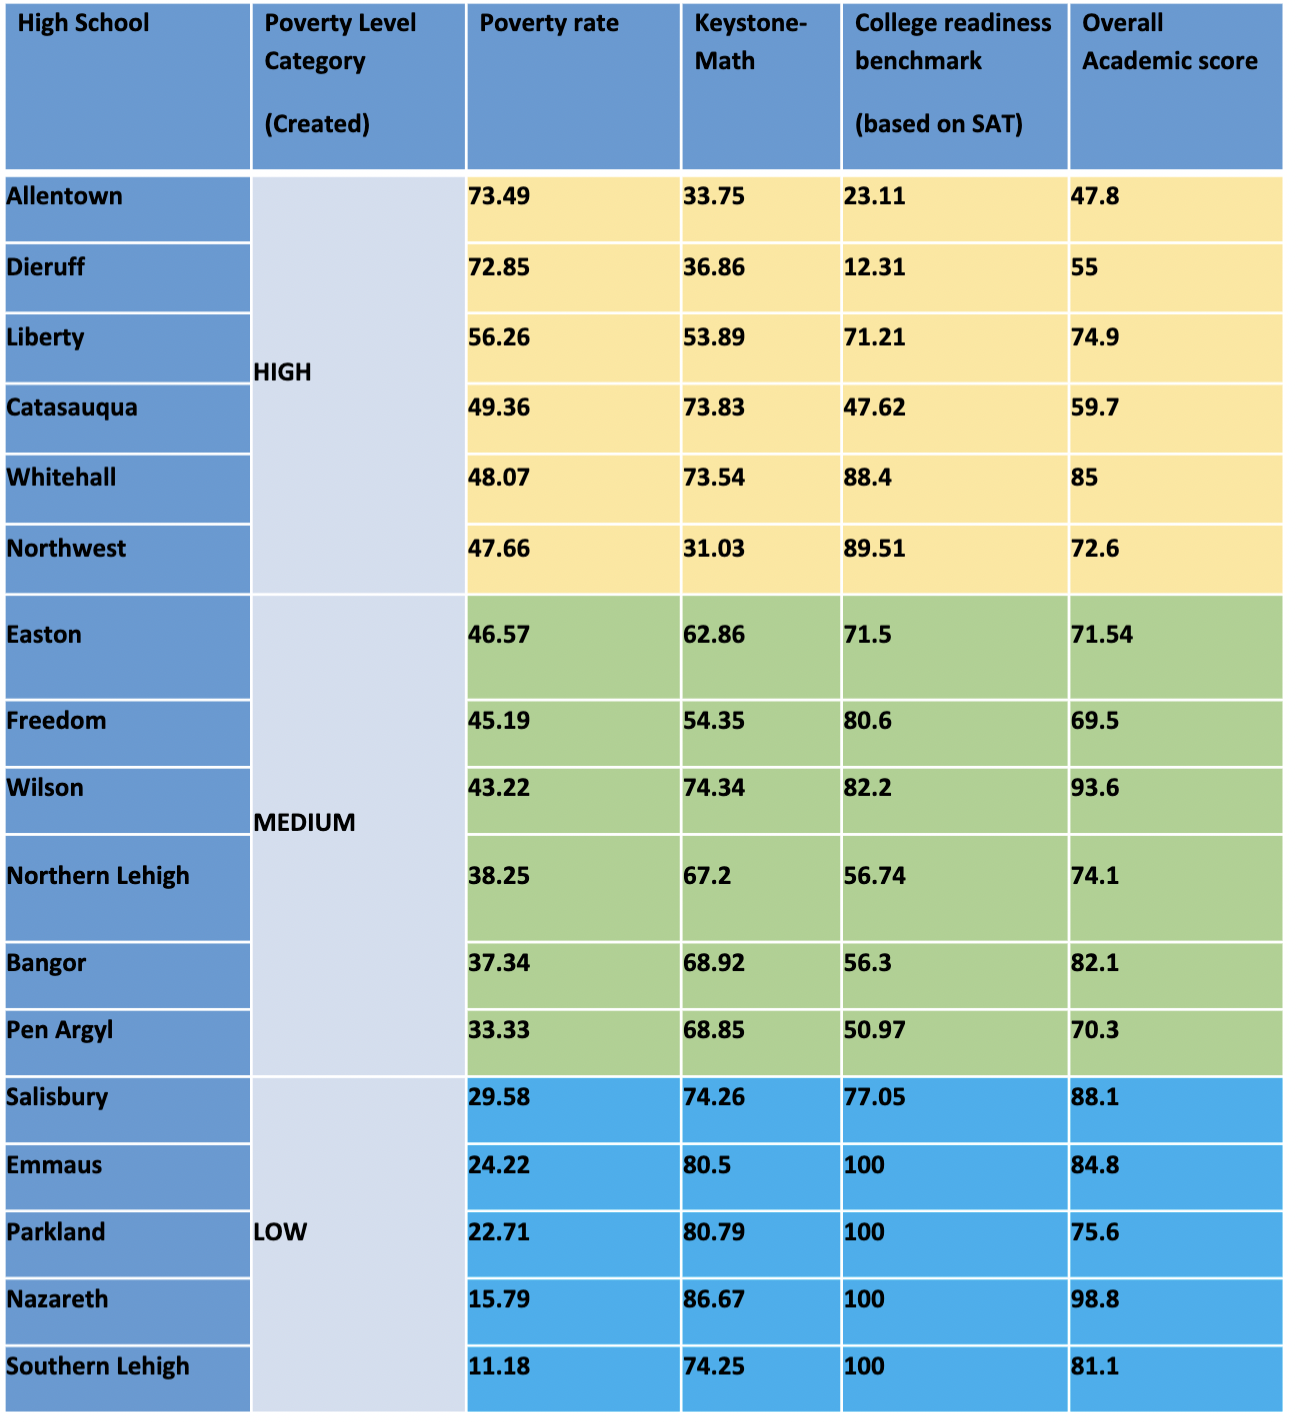
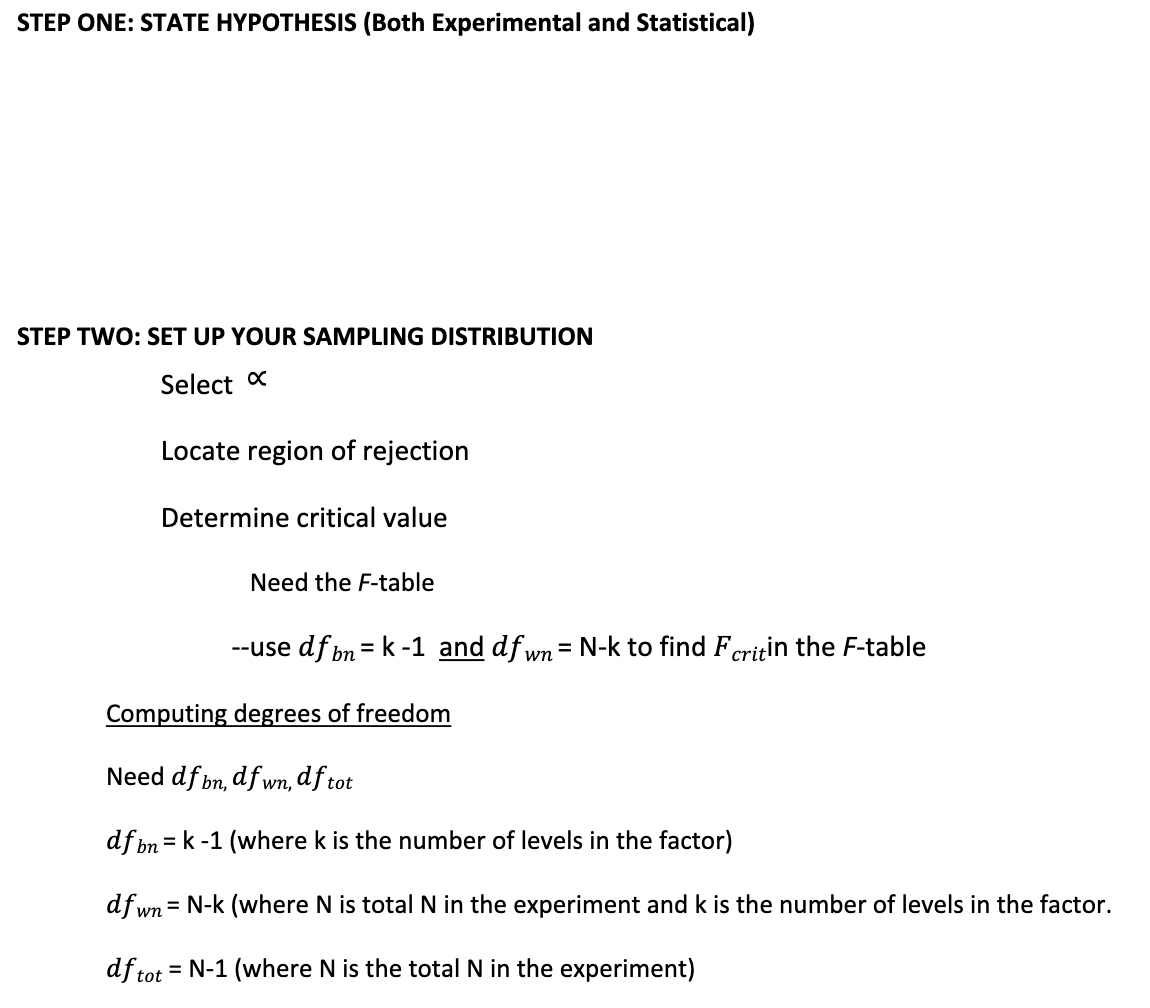
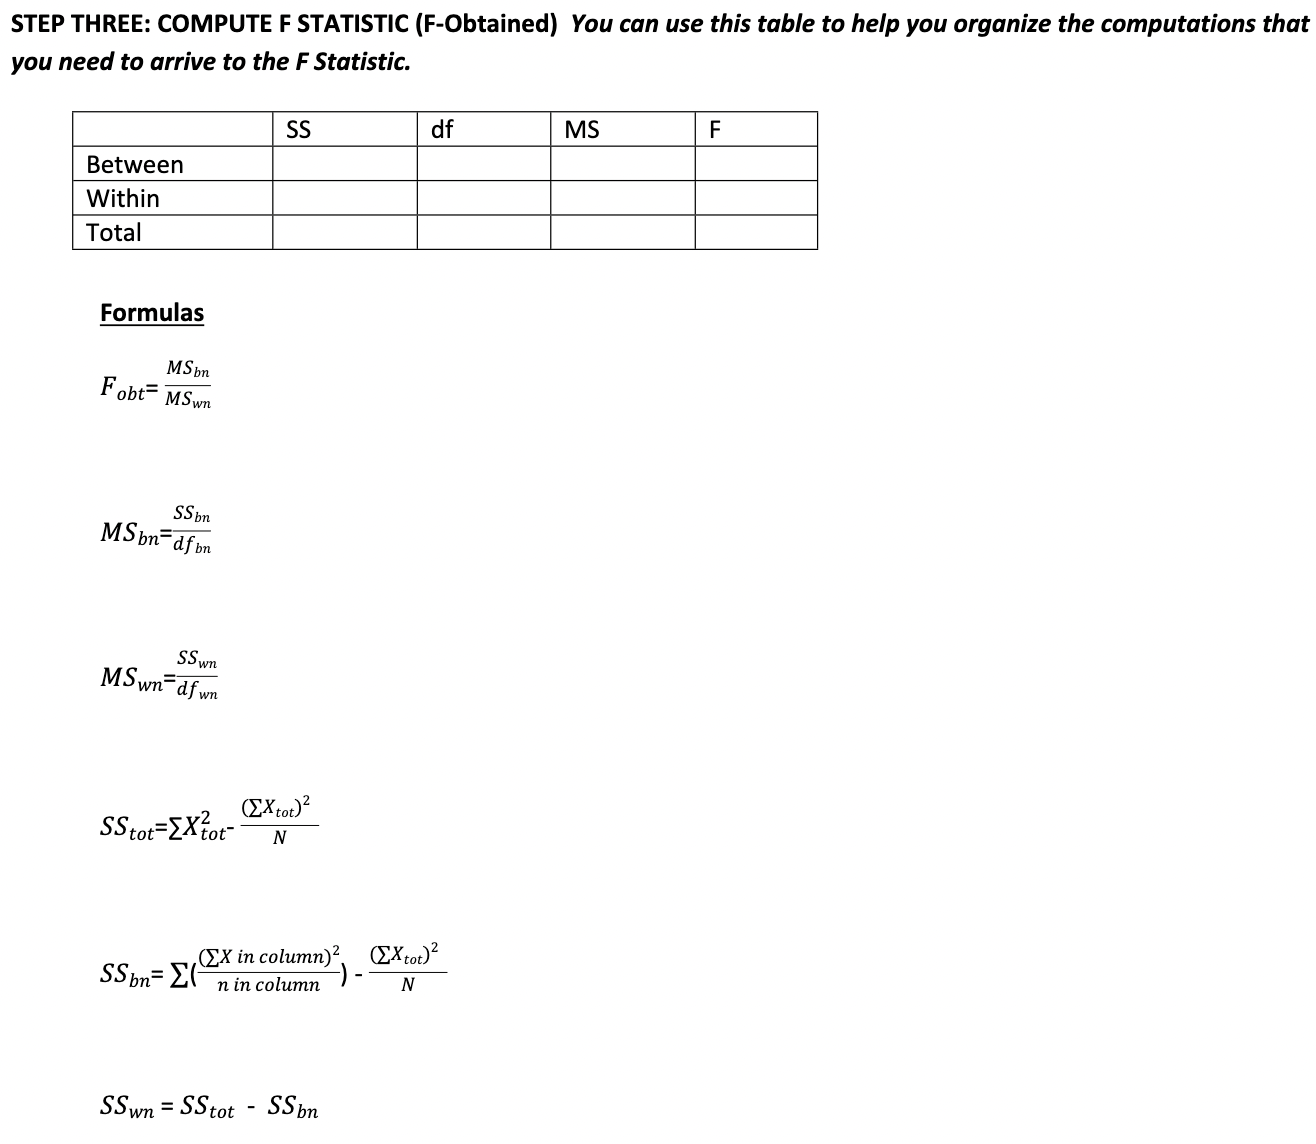
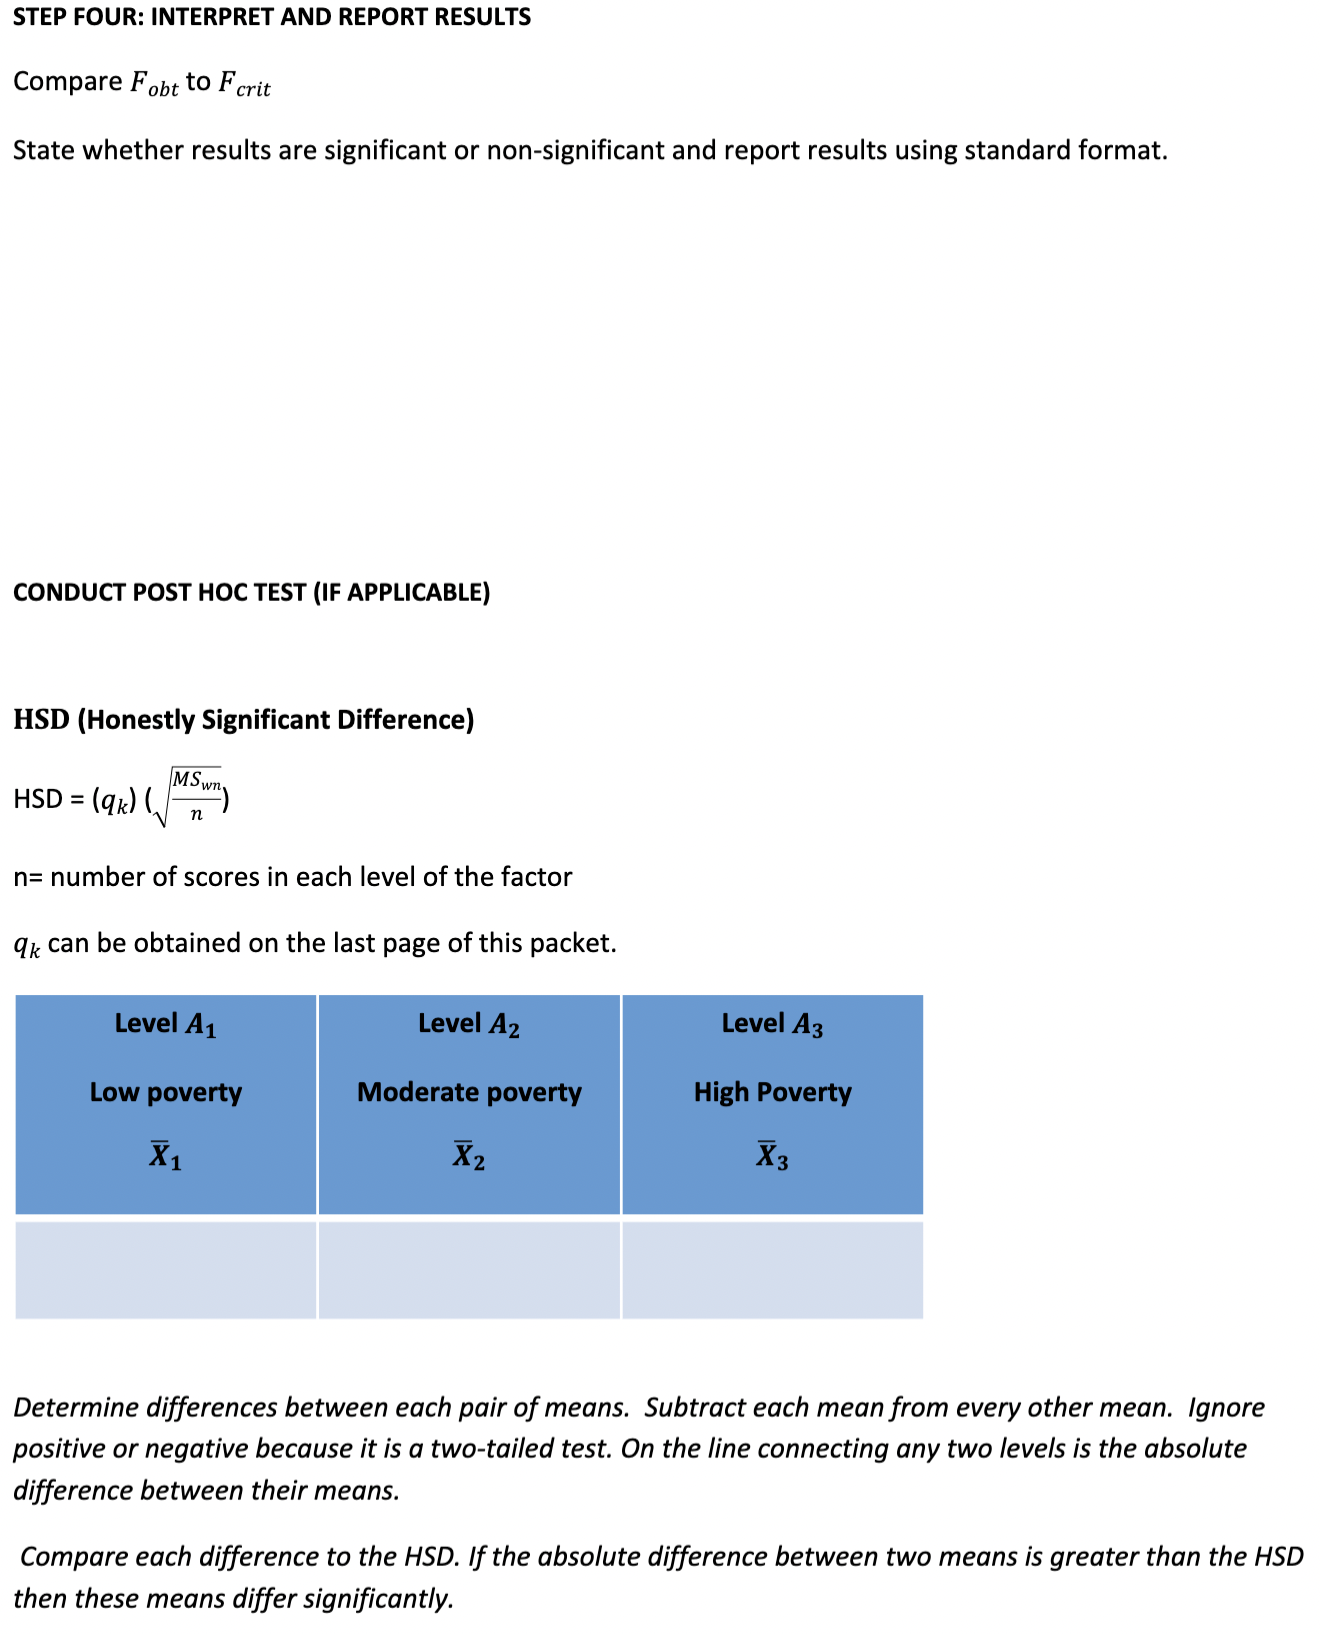
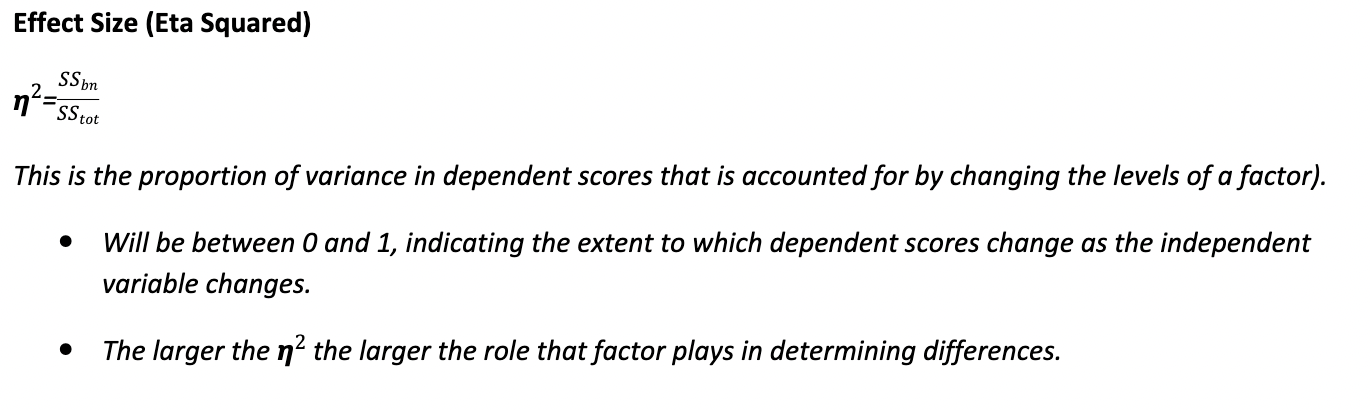
TEST THREE Does Amount of Poverty in a School Affect the 'Overall Academic Score" given to a school by the Pennsylvania Department of Education? Use the attached table to get your data. Data source: http://www.paschoolperformance.org Level A1 Level A2 Level A3 Conditions K = High Poverty Medium Poverty Low Poverty X X2 X X2 X X2 Totals EX = EX= EX= EXtot= EX2= Ex2= Ex2= Ex tot= n1= n2= n3= N= X 1= X 2= X 3= K=\fSTEP ONE: STATE HYPOTHESIS (Both Experimental and Statistical) STEP TWO: SET UP YOUR SAMPLING DISTRIBUTION Select Locate region of rejection Determine critical value Need the F-table --use dfon = k-1 and df wn = N-k to find Foritin the F-table Computing degrees of freedom Need dfon, df wn, af tot dfon = k-1 (where k is the number of levels in the factor) dfwn= N-k (where N is total N in the experiment and k is the number of levels in the factor. df tot = N-1 (where N is the total N in the experiment)STEP THREE: COMPUTE F STATISTIC (F-Obtained) You can use this table to help you organize the computations that you need to arrive to the F Statistic. SS df MS F Between Within Total Formulas MS bn Fobt= MSwn SS bn MSbn df bn SS wn MSwn df wn SStot=EXtot- (EX tot)2 N (Ex in column)? (EXtot)2 SSon= Z n in column N SSwn = SStot - SSbnSTEP FOUR: INTERPRET AND REPORT RESULTS Compare Fobt to Fcrit State whether results are significant or non-significant and report results using standard format. CONDUCT POST HOC TEST (IF APPLICABLE) HSD (Honestly Significant Difference) HSD = (qk) n= number of scores in each level of the factor qk can be obtained on the last page of this packet. Level A1 Level A2 Level A3 Low poverty Moderate poverty High Poverty X 1 X2 X3 Determine differences between each pair of means. Subtract each mean from every other mean. Ignore positive or negative because it is a two-tailed test. On the line connecting any two levels is the absolute difference between their means. Compare each difference to the HSD. If the absolute difference between two means is greater than the HSD then these means differ significantly.Effect Size (Eta Squared) 2 $3,,\" '7 '55:.\" This is the proportion of variance in dependent scores that is accounted for by changing the ieveis of a factor). 0 Wiii be between 0 and 1, indicating the extent to which dependent scores change as the independent variable changes. I The larger the 132 the larger the role that factor plays in determining differences
Step by Step Solution
There are 3 Steps involved in it

Get step-by-step solutions from verified subject matter experts