

Question: PLEASE ANSWER THIS QUESTION Presented below in the table are the population in more developed countries and less developed countries in the world at mid-year
 PLEASE ANSWER THIS QUESTION
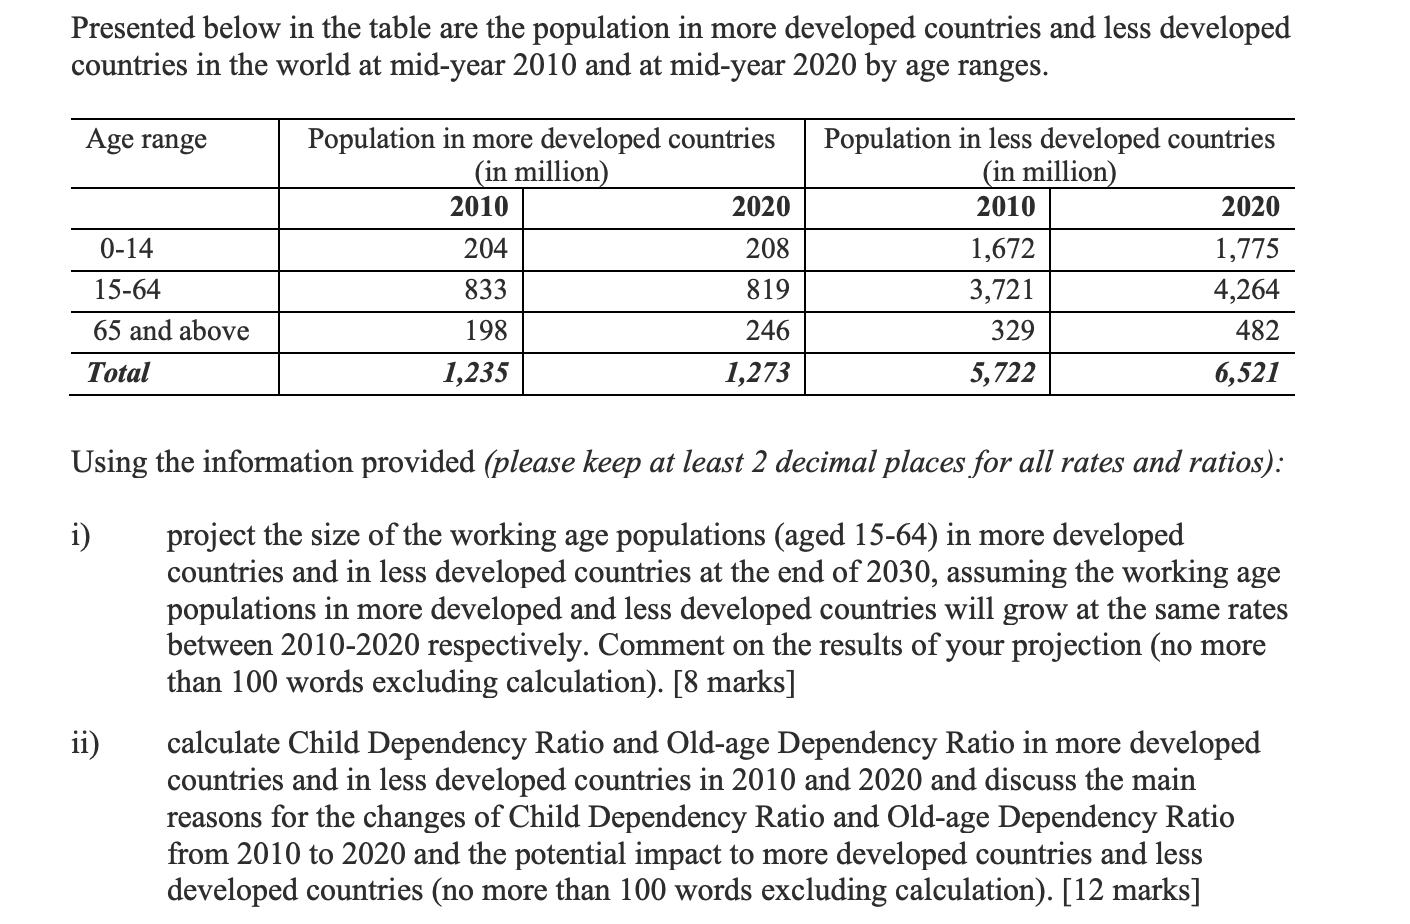
Presented below in the table are the population in more developed countries and less developed countries in the world at mid-year 2010 and at mid-year 2020 by age ranges. Age range Population in more developed countries (in million) Population in less developed countries (in million) 2010 2020 2010 2020 0-14 204 208 1,672 1,775 15-64 833 819 3,721 4,264 65 and above 198 246 329 482 Total 1,235 1,273 5,722 6,521 Using the information provided (please keep at least 2 decimal places for all rates and ratios): i) project the size of the working age populations (aged 15-64) in more developed countries and in less developed countries at the end of 2030, assuming the working age populations in more developed and less developed countries will grow at the same rates between 2010-2020 respectively. Comment on the results of your projection (no more than 100 words excluding calculation). [8 marks] ii) calculate Child Dependency Ratio and Old-age Dependency Ratio in more developed countries and in less developed countries in 2010 and 2020 and discuss the main reasons for the changes of Child Dependency Ratio and Old-age Dependency Ratio from 2010 to 2020 and the potential impact to more developed countries and less developed countries (no more than 100 words excluding calculation). [12 marks] Presented below in the table are the population in more developed countries and less developed countries in the world at mid-year 2010 and at mid-year 2020 by age ranges. Age range Population in more developed countries (in million) Population in less developed countries (in million) 2010 2020 2010 2020 0-14 204 208 1,672 1,775 15-64 833 819 3,721 4,264 65 and above 198 246 329 482 Total 1,235 1,273 5,722 6,521 Using the information provided (please keep at least 2 decimal places for all rates and ratios): i) project the size of the working age populations (aged 15-64) in more developed countries and in less developed countries at the end of 2030, assuming the working age populations in more developed and less developed countries will grow at the same rates between 2010-2020 respectively. Comment on the results of your projection (no more than 100 words excluding calculation). [8 marks] ii) calculate Child Dependency Ratio and Old-age Dependency Ratio in more developed countries and in less developed countries in 2010 and 2020 and discuss the main reasons for the changes of Child Dependency Ratio and Old-age Dependency Ratio from 2010 to 2020 and the potential impact to more developed countries and less developed countries (no more than 100 words excluding calculation). [12 marks]
Step by Step Solution
There are 3 Steps involved in it

Get step-by-step solutions from verified subject matter experts