

Question: Please answer this question using python. Question 1 Given the following data which contain 20 rows and 3 columns: X1, X2, and Y. X1 X2
Please answer this question using python.
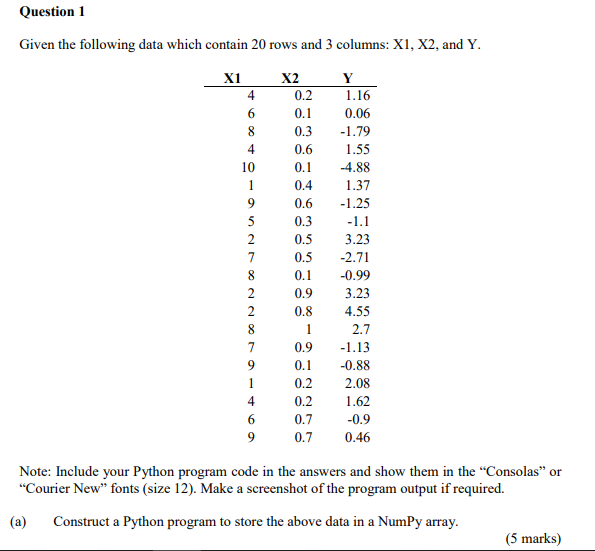
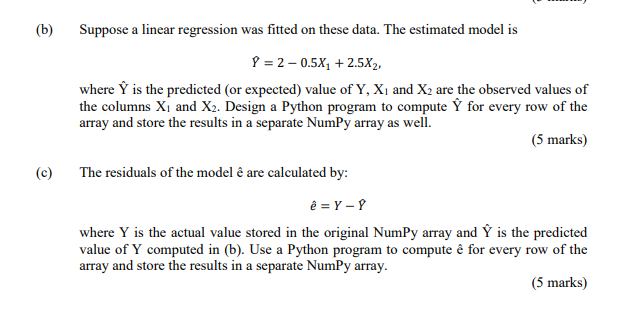
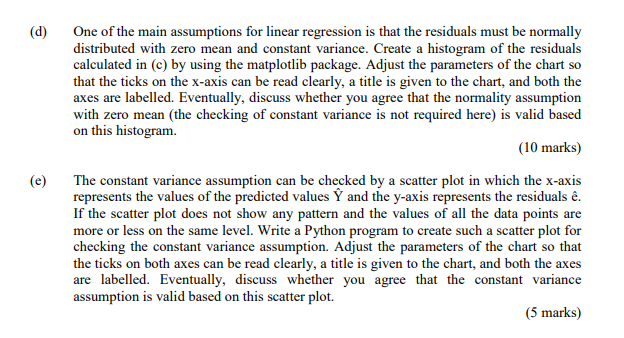
Question 1 Given the following data which contain 20 rows and 3 columns: X1, X2, and Y. X1 X2 Y 4 0.2 1.16 0.1 0.06 8 0.3 -1.79 0.6 1.55 0.1 -4.88 0.4 1.37 0.6 -1.25 0.3 -1.1 0.5 3.23 0.5 -2.71 0.1 -0.99 0.9 3.23 0.8 4.55 2.7 0.9 -1.13 0.1 -0.88 0.2 2.08 0.2 1.62 0.7 -0.9 0.7 0.46 Note: Include your Python program code in the answers and show them in the "Consolas" or "Courier New" fonts (size 12). Make a screenshot of the program output if required. (a) Construct a Python program to store the above data in a NumPy array. (5 marks)I.\" '__ '_.' {h} Suppose a linear regression was tted on these data. The estimated model is f = 2 c.5351 + 25.13, where 'i' is the predicted {or expected} value of Y, Xi and X: are the observed values of the columm Xi and X2. Design a Python program to compute 'i" for every row of the array and store the results in a separate NumPy arrayr as well. (5 marks} {e} The residuals of the model a are calculated by: =FP where Y is the actual value stored in the original NumPy array and 'i' is the predicted value of Y computed in [h]. Use a Python program to compute E for every row of the array and store the results in a separate NumPy array. (5 marks} {d} One of the main assumptions for linear regression is that the residuals must be normally distributed with zero mean and constant variance. Create a histogram of the residuals calculated in {c} by using the matplotlih package. Adjust the parameters of the chart so that the ticks on the x-axis can he read clearly, a title is given to the chart, and both the axes are labelled. Eventually, discuss whether you agree that the normality assumption with zero mean {the checking of constant variance is not required here} is valid based on this histogram. (Ill marks) {e} The constant variance assumption can be checked by a scatter plot in which the x-axis represents the values of the predicted values '1' and the y-axis represents the residuals e. If the scatter plot does not show any pattern and the values of all the data points are more or less on the same level. 1|Write a Python program to create such a scatter plot for checking the constant variance assumption. Adjust the parameters of the chart so that the ticks on both axes can he read clearly, a title is given to the chart, and both the axes are labelled. Eventually, discuss whether you agree that the constant variance assumption is valid based on this scatter plot. (5 marks}
Step by Step Solution
There are 3 Steps involved in it

Get step-by-step solutions from verified subject matter experts