

Question: Please answer this question with MATLAB ASAP! Q2: Dataset VegetarianDiet.xls are a sample of cholesterol levels taken from 24 hospital employees who were on a
Please answer this question with MATLAB ASAP!
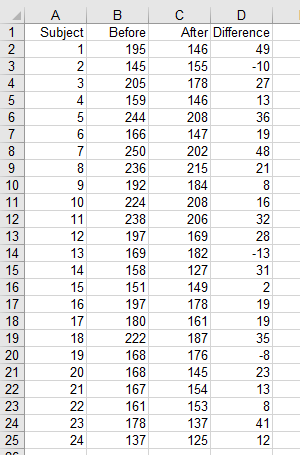
Q2: Dataset VegetarianDiet.xls are a sample of cholesterol levels taken from 24 hospital employees who were on a standard American diet and who agreed to adopt a vegetarian diet for 1 month. Serum-cholesterol measurements were made before adopting the diet and 1 month after. 2.1. Compute the mean change in cholesterol. 2.2. Compute the standard deviation of the change in cholesterol. 2.3. Compute the median change in cholesterol 2.4. Generate a box plot of the cholesterol change 2.5. Some investigators believe that the effects of diet on cholesterol are more evident in people with high rather than low cholesterol levels. If you split the data in Table 2.15 according to whether baseline cholesterol is above or below the median, can you comment descriptively on this (calculate the descriptive statistics and show as boxplots for the two distributions). A Subject 1 2 3 4 5 1 2 3 4 5 6 7 8 9 10 11 12 13 14 15 16 17 18 19 20 21 22 23 24 25 7 8 9 10 11 12 13 14 15 16 17 18 19 20 21 22 23 24 B Before 195 145 205 159 244 166 250 236 192 224 238 197 169 158 151 197 180 222 168 168 167 161 178 137 D After Difference 146 49 155 -10 178 27 146 13 208 36 147 19 202 48 215 21 184 8 208 16 206 32 169 28 182 -13 127 31 149 2 178 19 161 19 187 35 176 -8 145 23 154 13 153 8 137 41 125 12 Q2: Dataset VegetarianDiet.xls are a sample of cholesterol levels taken from 24 hospital employees who were on a standard American diet and who agreed to adopt a vegetarian diet for 1 month. Serum-cholesterol measurements were made before adopting the diet and 1 month after. 2.1. Compute the mean change in cholesterol. 2.2. Compute the standard deviation of the change in cholesterol. 2.3. Compute the median change in cholesterol 2.4. Generate a box plot of the cholesterol change 2.5. Some investigators believe that the effects of diet on cholesterol are more evident in people with high rather than low cholesterol levels. If you split the data in Table 2.15 according to whether baseline cholesterol is above or below the median, can you comment descriptively on this (calculate the descriptive statistics and show as boxplots for the two distributions). A Subject 1 2 3 4 5 1 2 3 4 5 6 7 8 9 10 11 12 13 14 15 16 17 18 19 20 21 22 23 24 25 7 8 9 10 11 12 13 14 15 16 17 18 19 20 21 22 23 24 B Before 195 145 205 159 244 166 250 236 192 224 238 197 169 158 151 197 180 222 168 168 167 161 178 137 D After Difference 146 49 155 -10 178 27 146 13 208 36 147 19 202 48 215 21 184 8 208 16 206 32 169 28 182 -13 127 31 149 2 178 19 161 19 187 35 176 -8 145 23 154 13 153 8 137 41 125 12Step by Step Solution
There are 3 Steps involved in it
1 Expert Approved Answer
Step: 1 Unlock

Question Has Been Solved by an Expert!
Get step-by-step solutions from verified subject matter experts
Step: 2 Unlock
Step: 3 Unlock