

Question: Please answer using the below Default template taking the expected output into consideration. The previous answers to this question returned the wrong sample proportion Default
Please answer using the below Default template taking the expected output into consideration. The previous answers to this question returned the wrong sample proportion
Default Template
# Import necessary modules
age = int(input())
# Read csv file titanic.csv into data frame
# Take the subset of the data where Embarked = "S" south = # Code to take subset
# Find total number in subset n1 = # Code to count number in subset
# Find number in subset where Age > age x1 = # Code to count number where Age > age
# Calculate proportion p1 = # Code to calculate proportion print(f'Sample proportion is {p1:.6f}')
# Calculate standard error stderr = # Code to calculate standard error
# Find 95% confidence interval conf_int = # Code to find confidence interval print(f'({conf_int[0]:.6f}, {conf_int[1]:.6f})')
# Find proportion for full data n2 = # Code to count number in data set x2 = # Code to count number in full data set where Age > age p2 = # Code to calculate proportion
# Determine if the actual proportion falls within the 95% confidence interval if conf_int[0]
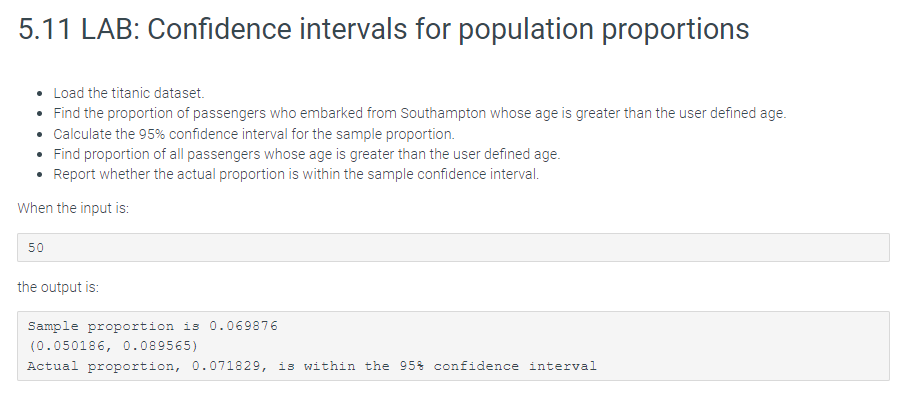
5.11 LAB: Confidence intervals for population proportions - Load the titanic dataset. - Find the proportion of passengers who embarked from Southampton whose age is greater than the user defined age. - Calculate the 95% confidence interval for the sample proportion. - Find proportion of all passengers whose age is greater than the user defined age. - Report whether the actual proportion is within the sample confidence interval. When the input is: 50 the output is: Sample proportion is 0.069876 (0.050186,0.089565) Actual proportion, 0.071829, is within the 958 confidence interval
Step by Step Solution
There are 3 Steps involved in it

Get step-by-step solutions from verified subject matter experts