

Question: PLEASE ANSWER WITH COMPLETE SOLUTION AND ALL THE SUB QUESTIONS BELOW The graph of a differentiable function f is shown in the figure below. If
PLEASE ANSWER WITH COMPLETE SOLUTION AND ALL THE SUB QUESTIONS BELOW
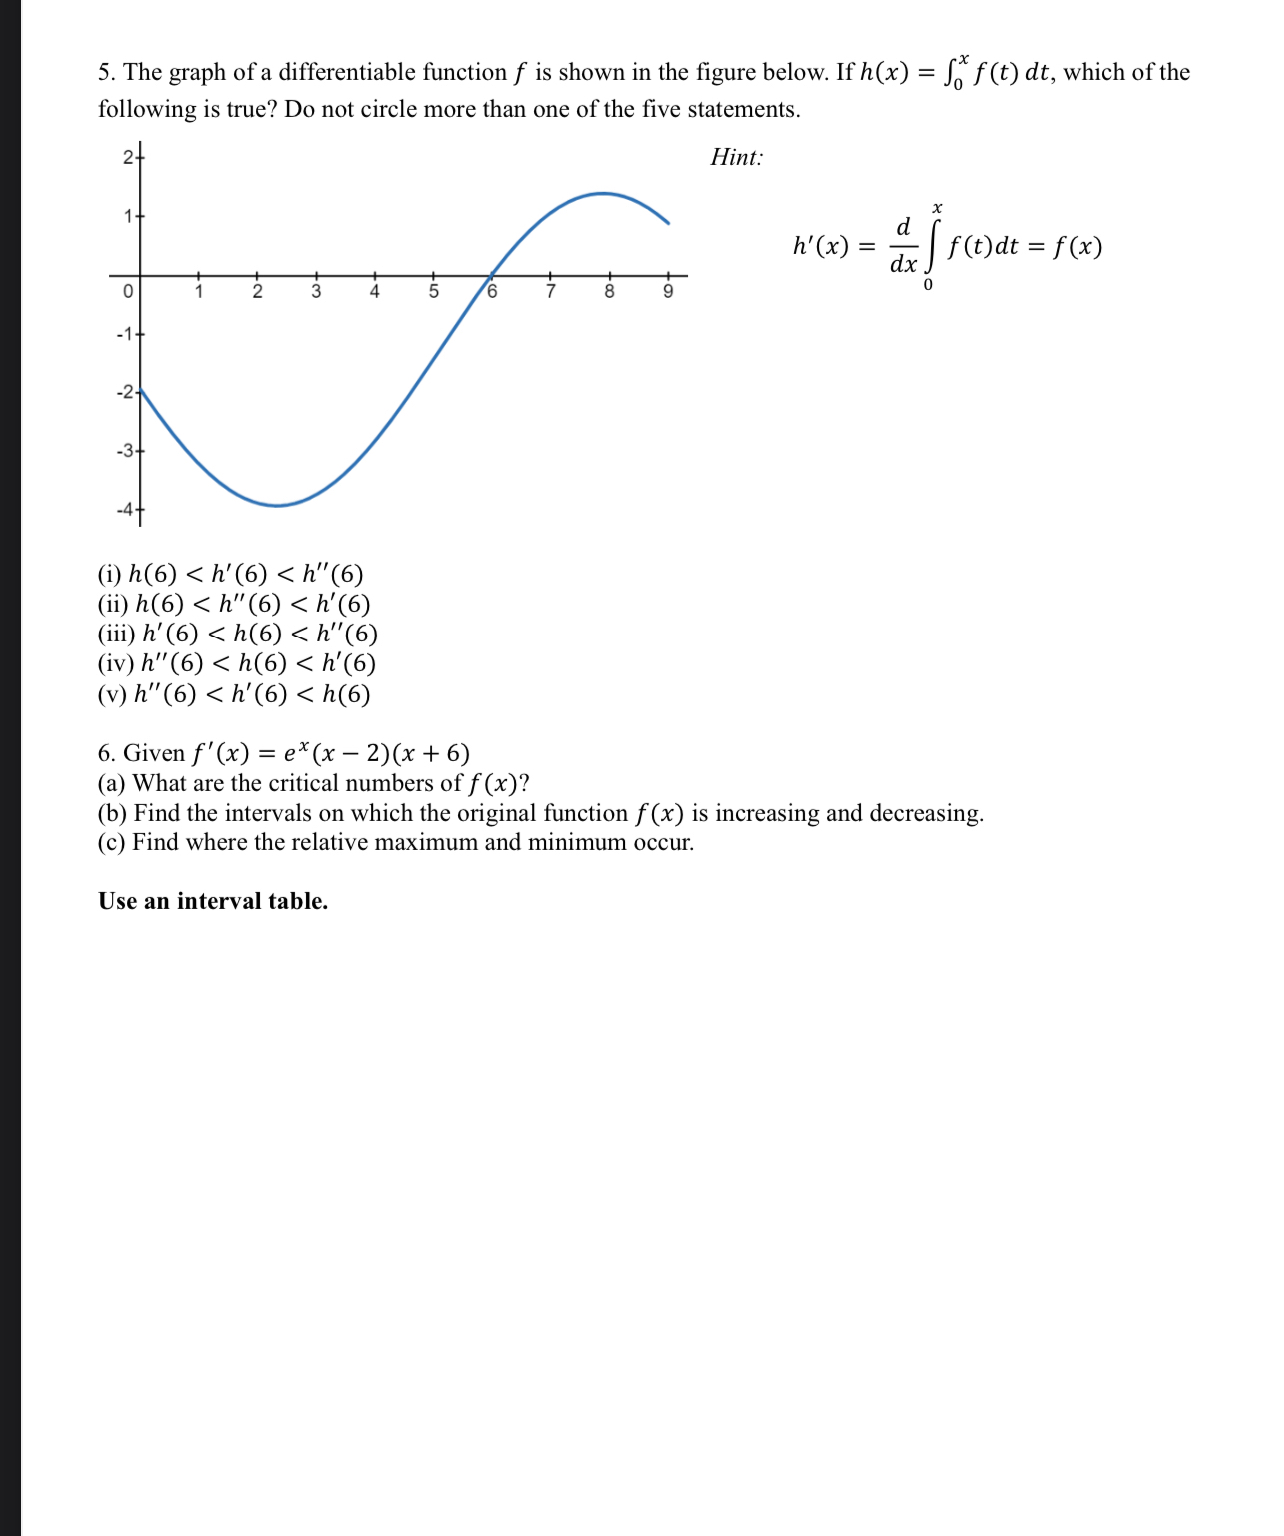
The graph of a differentiable function is shown in the figure below. If which of the following is true? Do not circle more than one of the five statements.
Fint:
i
Given
What are the critical numbers
Find the intervals which the original function increasing and decreasing.
Find where the relative maximum and minimum occur.
Use interval table.
Given
What are the critical numbers
Find the intervals which the original function increasing and decreasing.
Find where the relative maximum and minimum occur.
Use interval table.
Given
What are the critical numbers
Find the intervals which the original function increasing and decreasing.
Find where the relative maximum and minimum occur.
Use interval table.
Given
What are the critical numbers
Find the intervals which the original function increasing and decreasing.
Find where the relative maximum and minimum occur.
Use interval table.
Given
What are the critical numbers
Find the intervals which the original function increasing and decreasing.
Find where the relative maximum and minimum occur.
Use interval table.
Step by Step Solution
There are 3 Steps involved in it
1 Expert Approved Answer
Step: 1 Unlock

Question Has Been Solved by an Expert!
Get step-by-step solutions from verified subject matter experts
Step: 2 Unlock
Step: 3 Unlock