

Question: please answer with excel. having trouble with getting the equations from the graphs. 3. The following data describe the sequence of chemical reactions ABC. The
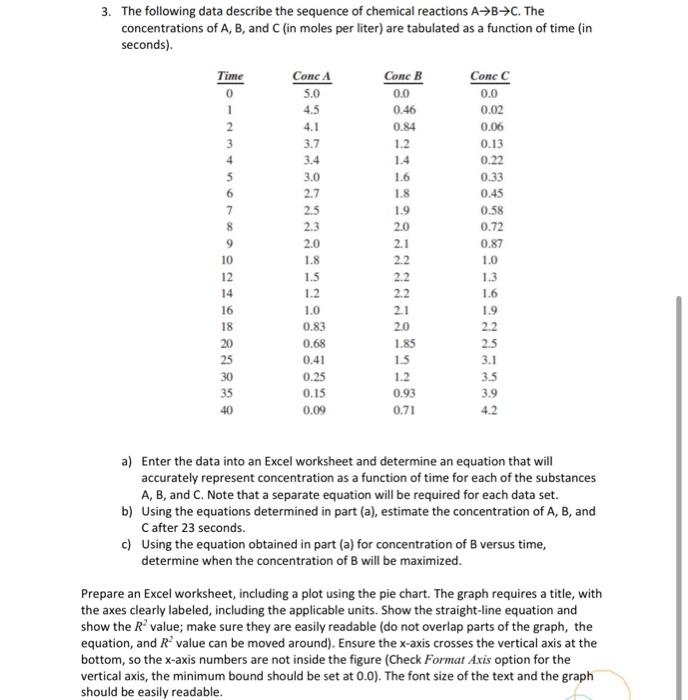
3. The following data describe the sequence of chemical reactions ABC. The concentrations of A,B, and C (in moles per liter) are tabulated as a function of time (in seconds). a) Enter the data into an Excel worksheet and determine an equation that will accurately represent concentration as a function of time for each of the substances A,B, and C. Note that a separate equation will be required for each data set. b) Using the equations determined in part (a), estimate the concentration of A, B, and C after 23 seconds. c) Using the equation obtained in part (a) for concentration of B versus time, determine when the concentration of B will be maximized. Prepare an Excel worksheet, including a plot using the pie chart. The graph requires a title, with the axes clearly labeled, including the applicable units. Show the straight-line equation and show the R2 value; make sure they are easily readable (do not overlap parts of the graph, the equation, and R2 value can be moved around). Ensure the x-axis crosses the vertical axis at the bottom, so the x-axis numbers are not inside the figure (Check Format Axis option for the vertical axis, the minimum bound should be set at 0.0 ). The font size of the text and the graph should be easily readable
Step by Step Solution
There are 3 Steps involved in it

Get step-by-step solutions from verified subject matter experts