

Question: Please answer with excel screenshots with FORMULAS. Please no scratch paper. Thank you! P.S. The question is in the grey shaded area at the top
Please answer with excel screenshots with FORMULAS. Please no scratch paper. Thank you! P.S. The question is in the grey shaded area at the top of the screenshot.
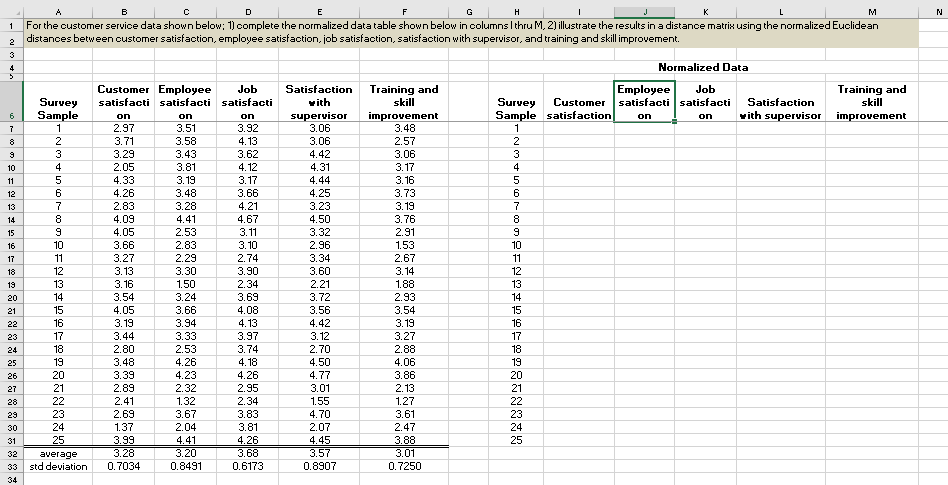
A B C D E F G H 1 K M For the customer service data shown below; 1) complete the normalized data table shown below in columns | thru M. 2) illustrate the results in a distance matrix using the normalized Euclidean distances between customer satisfaction, employee satisfaction, job satisfaction, satisfaction with supervisor, and training and skill improvement. Normalized Data Customer Employee Job Satisfaction Training and Survey Employee Job satisfacti satisfacti satisfacti Training and with skill Sample Survey Customer satisfacti satisfacti on on Satisfaction skill on supervisor improvement Sample satisfaction on -J 1 2.97 3.51 on 3.92 3.06 with supervisor 3.48 improvement 3.71 3.58 4.13 3.06 2.57 3.29 3.43 3.62 4.42 3.06 2.05 3.81 4.12 4.31 3.17 4.33 3.19 3.17 4.44 3.16 4.26 3.48 3.66 4.25 3.73 2.83 3.28 4.21 3.23 3.19 4.09 4.41 4.67 4.50 3.76 4.05 2.53 3.11 3.32 2.91 3.66 2.83 3.10 2.96 1.53 11 3.27 2.29 2.74 3.34 2.67 12 3.13 3.30 3.90 3.60 3.14 12 13 3.16 1.50 2.34 2.21 1.88 13 20 14 3.54 3.24 3.69 3.72 2.93 14 15 4.05 3.66 4.08 3.56 3.54 15 22 16 3.19 3.94 4. 13 4.42 3.19 16 23 17 3.44 3.33 3.97 3.12 3.27 17 24 18 2.80 2.53 3.74 2.70 2.88 18 25 19 3.48 4.26 4. 18 4.50 4.06 19 26 20 3.39 4.23 4.26 4.77 3.86 20 27 21 2.89 2.32 2.95 3.01 2.13 21 28 22 2.41 1.32 2.34 1.55 1.27 22 23 23 2.69 3.67 3.83 4.70 3.61 23 30 24 1.37 2.04 3.81 2.07 2.47 24 31 25 3.99 4.4- 4.26 4.45 3.88 25 32 average 3.28 3.20 3.68 3.57 3.01 33 std deviation 0.7034 0.8491 0.6173 0.8907 0.7250 34
Step by Step Solution
There are 3 Steps involved in it

Get step-by-step solutions from verified subject matter experts