

Question: Please answer with explanation. 1. Draw a correctly labeled graph of a production function that exhibits diminishing returns to labor. Assume labor is the variable
Please answer with explanation.
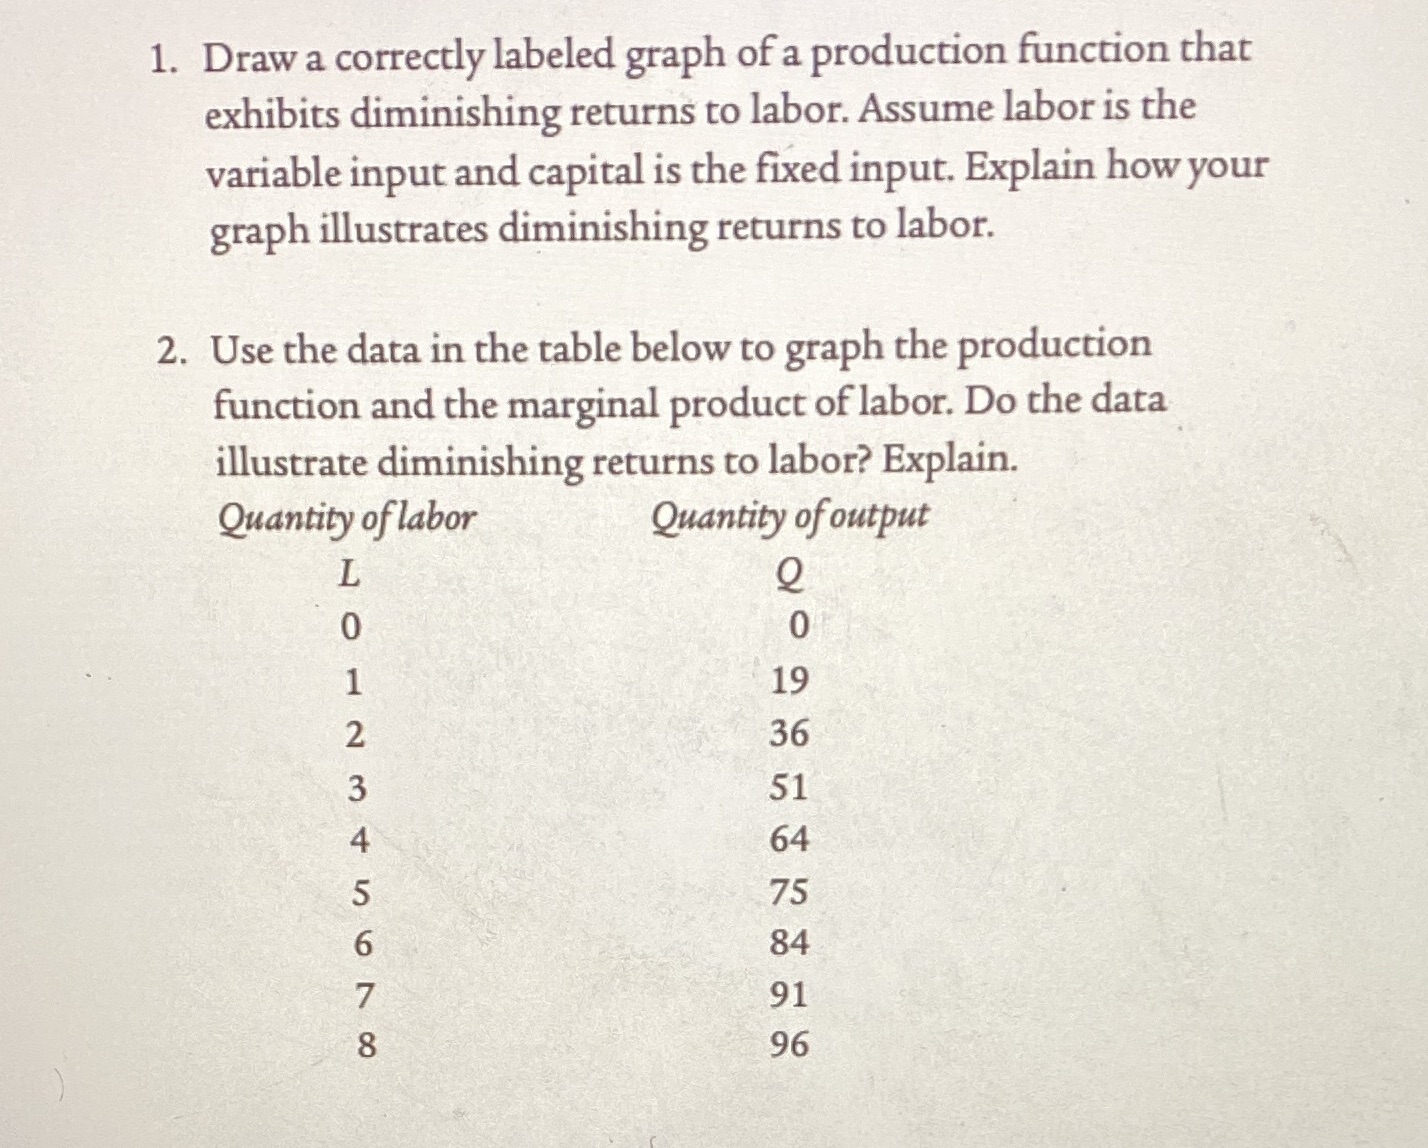
1. Draw a correctly labeled graph of a production function that exhibits diminishing returns to labor. Assume labor is the variable input and capital is the fixed input. Explain how your graph illustrates diminishing returns to labor. 2. Use the data in the table below to graph the production function and the marginal product of labor. Do the data illustrate diminishing returns to labor? Explain. Quantity of labor Quantity of output 19 36 75 84 91 96
Step by Step Solution
There are 3 Steps involved in it
1 Expert Approved Answer
Step: 1 Unlock

Question Has Been Solved by an Expert!
Get step-by-step solutions from verified subject matter experts
Step: 2 Unlock
Step: 3 Unlock