Question: please answer with n=4 . Tutors keep using other similiar problems to answer and im not understanding. please show all the formulas used and be

please answer with n=4 . Tutors keep using other similiar problems to answer and im not understanding. please show all the formulas used and be very detailed so I can understand. Thanks please answer with n=4 . Tutors keep using other
8. A textbook publisher wants to determine process control charts for the textbook height. The following table shows the first 20 samples of n=4 sample size of the production of the text. 6. Sample X bar Range 10 9.97 10.04 10.01 10.01 10.00 9.98 9.99 9.99 9.98 10.01 .04 .02 .05 .01 .04 .03 .03 .05 .01 .01 17 15 16 18 14 19 12 13 20 Sample X bar Range 11 sum 9.96 10.04 10.02 9.95 10.01 10.00 10.00 10.01 10.02 10,01 .03 .04 .04 .02 .01 .03 .06 .05 .03 .04 a. (15 points) What are the upper and lower control limits for the X bar chart using the data from the samples above? b. (15 points) What are the upper and lower control limits for the R chart using the data from the samples above? c. (10 points) Plot the control limits and the observations on the charts attached. Proper scaling, labeling and neatness counts. d. (5 points) Discuss the charts you have plotted. What conclusions and recommendations do you make from those charts and the data

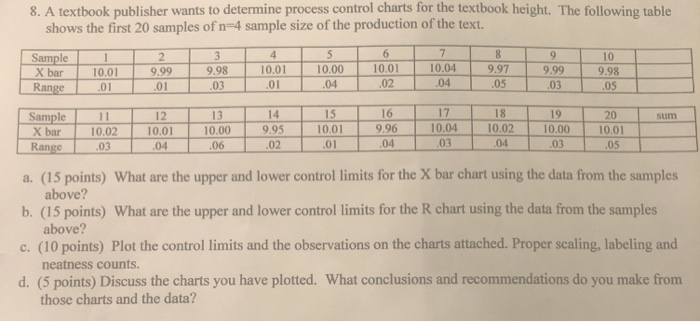
Step by Step Solution

There are 3 Steps involved in it

1 Expert Approved Answer
Step: 1 Unlock blur-text-image
Question Has Been Solved by an Expert!

Get step-by-step solutions from verified subject matter experts

Step: 2 Unlock
Step: 3 Unlock

Students Have Also Explored These Related General Management Questions!