

Question: please answer within ten minutes thanks (Expected return and risk) The following data represent returns for the common stocks over a one-year period. Probability Returns
please answer within ten minutes thanks
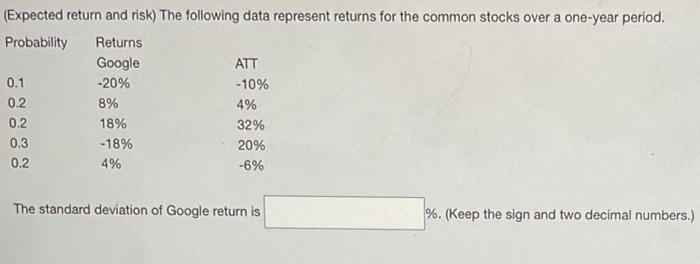
(Expected return and risk) The following data represent returns for the common stocks over a one-year period. Probability Returns Google ATT 0.1 -20% -10% 0.2 8% 4% 0.2 18% 32% 0.3 -18% 20% 0.2 4% -6% The standard deviation of Google return is %. (Keep the sign and two decimal numbers.)
Step by Step Solution
There are 3 Steps involved in it
1 Expert Approved Answer
Step: 1 Unlock

Question Has Been Solved by an Expert!
Get step-by-step solutions from verified subject matter experts
Step: 2 Unlock
Step: 3 Unlock