

Question: Please answers these questions. Using the box plot shown, answer the following questions: % O 10 20 3O 40 I 3. Estimate the S-number summa
Please answers these questions.
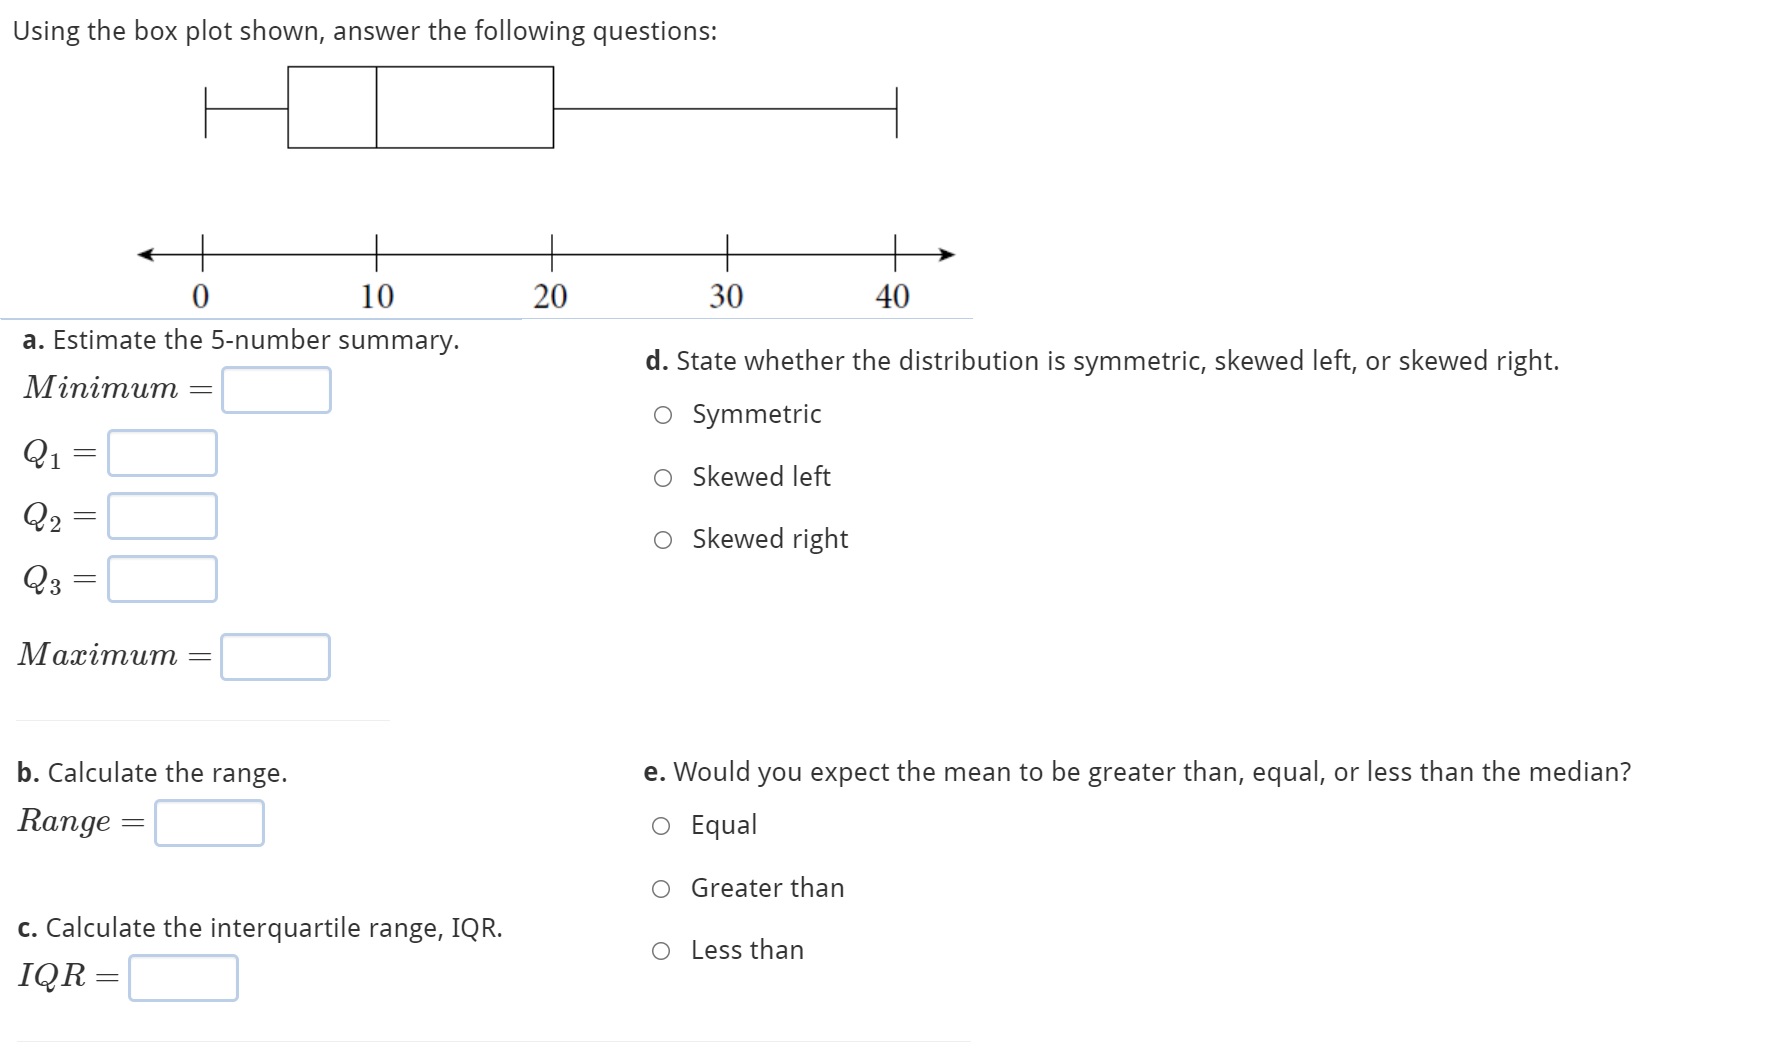
Using the box plot shown, answer the following questions: %
Step by Step Solution
There are 3 Steps involved in it
1 Expert Approved Answer
Step: 1 Unlock

Question Has Been Solved by an Expert!
Get step-by-step solutions from verified subject matter experts
Step: 2 Unlock
Step: 3 Unlock