

Question: please answr G,H,I Instructions: . . Submit an excel printout using DATA ANALYSIS for a linear regression. Highlight all relevant information for your problem. Submit
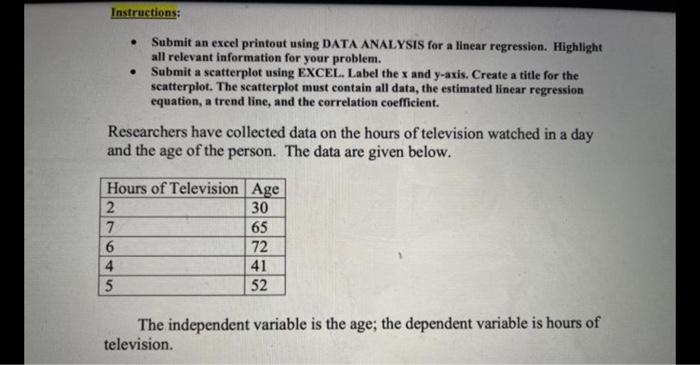

Instructions: . . Submit an excel printout using DATA ANALYSIS for a linear regression. Highlight all relevant information for your problem. Submit a scatterplot using EXCEL Label the x and y-axis. Create a title for the scatterplot. The seatterplot must contain all data, the estimated linear regression equation, a trend line, and the correlation coefficient. Researchers have collected data on the hours of television watched in a day and the age of the person. The data are given below. Hours of Television Age 2 30 7 65 6 4 41 5 52 72 The independent variable is the age; the dependent variable is hours of television. Instructions: . . Submit an excel printout using DATA ANALYSIS for a linear regression. Highlight all relevant information for your problem. Submit a scatterplot using EXCEL Label the x and y-axis. Create a title for the scatterplot. The seatterplot must contain all data, the estimated linear regression equation, a trend line, and the correlation coefficient. Researchers have collected data on the hours of television watched in a day and the age of the person. The data are given below. Hours of Television Age 2 30 7 65 6 4 41 5 52 72 The independent variable is the age; the dependent variable is hours of television
Step by Step Solution
There are 3 Steps involved in it

Get step-by-step solutions from verified subject matter experts