

Question: Please Anwer with Excel and with Formulas when needed thank you! Zoom into the image if it is too blurry. I need the correct inputs
Please Anwer with Excel and with Formulas when needed thank you!
Zoom into the image if it is too blurry. I need the correct inputs for the yellow cells!
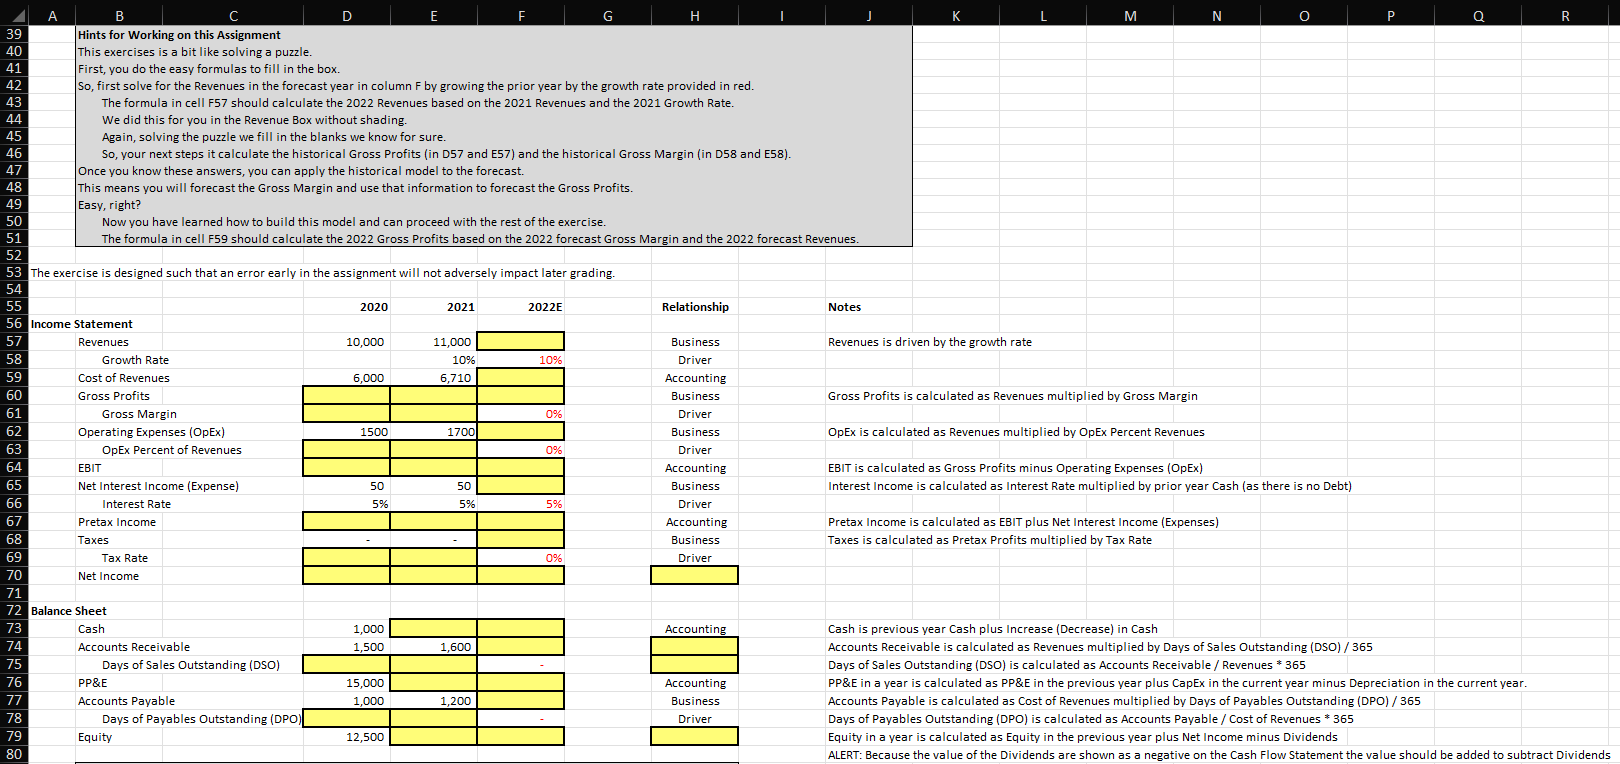
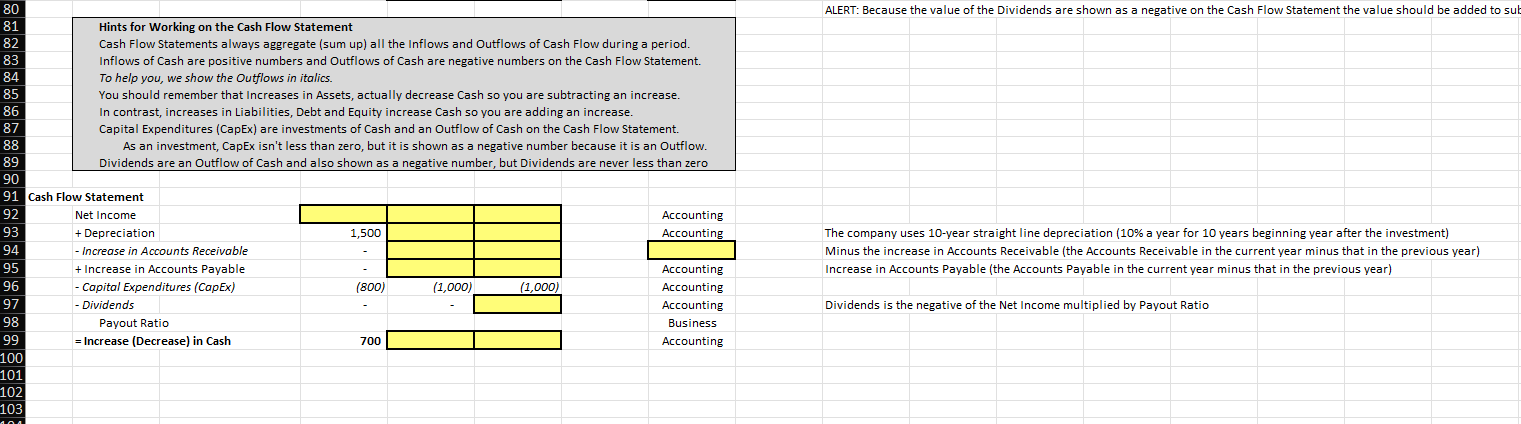
51 A B C D E F F G H K M N 0 P Q R 39 Hints for Working on this Assignment 40 This exercises is a bit like solving a puzzle. 41 First, you do the easy formulas to fill in the box. 42 So, first solve for the Revenues in the forecast year in column F by growing the prior year by the growth rate provided in red. 43 The formula in cell F57 should calculate the 2022 Revenues based on the 2021 Revenues and the 2021 Growth Rate. . 44 We did this for you in the Revenue Box without shading. 45 Again, solving the puzzle we fill in the blanks we know for sure. 46 So, your next steps it calculate the historical Gross Profits (in D57 and E57) and the historical Gross Margin (in D58 and E58). 47 Once you know these answers, you can apply the historical model to the forecast. 48 This means you will forecast the Gross Margin and use that information to forecast the Gross Profits. 49 Easy, right? 50 Now you have learned how to build this model and can proceed with the rest of the exercise. The formula in cell F59 should calculate the 2022 Gross Profits based on the 2022 forecast Gross Margin and the 2022 forecast Revenues. 52 53 The exercise is designed such that an error early in the assignment will not adversely impact later grading. 54 55 2020 2021 2022E Relationship Notes 56 Income Statement 57 Revenues 10,000 11,000 Business Revenues is driven by the growth rate 58 Growth Rate 10% 10% Driver 59 Cost of Revenues 6,000 6,710 Accounting 60 Gross Profits Business Gross Profits is calculated as Revenues multiplied by Gross Margin 61 Gross Margin 0% Driver 62 Operating Expenses (OpEx) 1500 1700 Business OpEx is calculated as Revenues multiplied by OpEx Percent Revenues 63 OpEx Percent of Revenues 0% Driver 64 EBIT Accounting EBIT is calculated as Gross Profits minus Operating Expenses (OpEx) 65 Net Interest Income (Expense) 50 50 Business Interest Income is calculated as Interest Rate multiplied by prior year Cash (as there is no Debt) 66 Interest Rate 5% 5% Driver 67 Pretax Income Accounting Pretax Income is calculated as EBIT plus Net Interest Income (Expenses) 68 Taxes Business Taxes is calculated as Pretax Profits multiplied by Tax Rate 69 Tax Rate 0% Driver 70 Net Income 71 72 Balance Sheet 73 Cash 1,000 Accounting Cash is previous year Cash plus Increase (Decrease) in Cash 74 Accounts Receivable 1,500 1,600 Accounts Receivable is calculated as Revenues multiplied by Days of Sales Outstanding (DSO)/365 75 Days of Sales Outstanding (DSO) Days of Sales Outstanding (DSO) is calculated as Accounts Receivable / Revenues * 365 76 PP&E 15,000 Accounting PP&E in a year is calculated as PP&E in the previous year plus CapEx in the current year minus Depreciation in the current year. 77 Accounts Payable 1,000 1,200 Business Accounts Payable is calculated as Cost of Revenues multiplied by Days of Payables Outstanding (DPO)/365 78 Days of Payables Outstanding (DPO) Driver Days of Payables Outstanding (DPO) is calculated as Accounts Payable / Cost of Revenues * 365 79 Equity 12,500 Equity in a year is calculated as Equity in the previous year plus Net Income minus Dividends 80 ALERT: Because the value of the Dividends are shown as a negative on the Cash Flow Statement the value should be added to subtract Dividends 5% a ALERT: Because the value of the Dividends are shown as a negative on the Cash Flow Statement the value should be added to sub 80 81 Hints for Working on the Cash Flow Statement 82 Cash Flow Statements always aggregate (sum up) all the inflows and Outflows of Cash Flow during a period. 83 Inflows of Cash are positive numbers and Outflows of Cash are negative numbers on the Cash Flow Statement. 84 To help you, we show the Outflows in italics. 85 You should remember that Increases in Assets, actually decrease Cash so you are subtracting an increase 86 In contrast, increases in Liabilities, Debt and Equity increase Cash so you are adding an increase. 87 Capital Expenditures (CapEx) are investments of Cash and an Outflow of Cash on the Cash Flow Statement. 88 As an investment, CapEx isn't less than zero, but it is shown as a negative number because it is an Outflow. 89 Dividends are an Outflow of Cash and also shown as a negative number, but Dividends are never less than zero 90 91 Cash Flow Statement 92 Net Income Accounting 93 + Depreciation 1,500 Accounting 94 - Increase in Accounts Receivable 95 + Increase in Accounts Payable Accounting 96 - Capital Expenditures (CapEx) (800) (1,000) (1,000) Accounting 97 - Dividends Accounting 98 Payout Ratio Business 99 = Increase (Decrease) in Cash 700 Accounting 100 101 102 103 - The company uses 10-year straight line depreciation (10% a year for 10 years beginning year after the investment) Minus the increase in Accounts Receivable (the Accounts Receivable in the current year minus that in the previous year) Increase in Accounts Payable (the Accounts Payable in the current year minus that in the previous year) Dividends is the negative of the Net Income multiplied by Payout Ratio 10 51 A B C D E F F G H K M N 0 P Q R 39 Hints for Working on this Assignment 40 This exercises is a bit like solving a puzzle. 41 First, you do the easy formulas to fill in the box. 42 So, first solve for the Revenues in the forecast year in column F by growing the prior year by the growth rate provided in red. 43 The formula in cell F57 should calculate the 2022 Revenues based on the 2021 Revenues and the 2021 Growth Rate. . 44 We did this for you in the Revenue Box without shading. 45 Again, solving the puzzle we fill in the blanks we know for sure. 46 So, your next steps it calculate the historical Gross Profits (in D57 and E57) and the historical Gross Margin (in D58 and E58). 47 Once you know these answers, you can apply the historical model to the forecast. 48 This means you will forecast the Gross Margin and use that information to forecast the Gross Profits. 49 Easy, right? 50 Now you have learned how to build this model and can proceed with the rest of the exercise. The formula in cell F59 should calculate the 2022 Gross Profits based on the 2022 forecast Gross Margin and the 2022 forecast Revenues. 52 53 The exercise is designed such that an error early in the assignment will not adversely impact later grading. 54 55 2020 2021 2022E Relationship Notes 56 Income Statement 57 Revenues 10,000 11,000 Business Revenues is driven by the growth rate 58 Growth Rate 10% 10% Driver 59 Cost of Revenues 6,000 6,710 Accounting 60 Gross Profits Business Gross Profits is calculated as Revenues multiplied by Gross Margin 61 Gross Margin 0% Driver 62 Operating Expenses (OpEx) 1500 1700 Business OpEx is calculated as Revenues multiplied by OpEx Percent Revenues 63 OpEx Percent of Revenues 0% Driver 64 EBIT Accounting EBIT is calculated as Gross Profits minus Operating Expenses (OpEx) 65 Net Interest Income (Expense) 50 50 Business Interest Income is calculated as Interest Rate multiplied by prior year Cash (as there is no Debt) 66 Interest Rate 5% 5% Driver 67 Pretax Income Accounting Pretax Income is calculated as EBIT plus Net Interest Income (Expenses) 68 Taxes Business Taxes is calculated as Pretax Profits multiplied by Tax Rate 69 Tax Rate 0% Driver 70 Net Income 71 72 Balance Sheet 73 Cash 1,000 Accounting Cash is previous year Cash plus Increase (Decrease) in Cash 74 Accounts Receivable 1,500 1,600 Accounts Receivable is calculated as Revenues multiplied by Days of Sales Outstanding (DSO)/365 75 Days of Sales Outstanding (DSO) Days of Sales Outstanding (DSO) is calculated as Accounts Receivable / Revenues * 365 76 PP&E 15,000 Accounting PP&E in a year is calculated as PP&E in the previous year plus CapEx in the current year minus Depreciation in the current year. 77 Accounts Payable 1,000 1,200 Business Accounts Payable is calculated as Cost of Revenues multiplied by Days of Payables Outstanding (DPO)/365 78 Days of Payables Outstanding (DPO) Driver Days of Payables Outstanding (DPO) is calculated as Accounts Payable / Cost of Revenues * 365 79 Equity 12,500 Equity in a year is calculated as Equity in the previous year plus Net Income minus Dividends 80 ALERT: Because the value of the Dividends are shown as a negative on the Cash Flow Statement the value should be added to subtract Dividends 5% a ALERT: Because the value of the Dividends are shown as a negative on the Cash Flow Statement the value should be added to sub 80 81 Hints for Working on the Cash Flow Statement 82 Cash Flow Statements always aggregate (sum up) all the inflows and Outflows of Cash Flow during a period. 83 Inflows of Cash are positive numbers and Outflows of Cash are negative numbers on the Cash Flow Statement. 84 To help you, we show the Outflows in italics. 85 You should remember that Increases in Assets, actually decrease Cash so you are subtracting an increase 86 In contrast, increases in Liabilities, Debt and Equity increase Cash so you are adding an increase. 87 Capital Expenditures (CapEx) are investments of Cash and an Outflow of Cash on the Cash Flow Statement. 88 As an investment, CapEx isn't less than zero, but it is shown as a negative number because it is an Outflow. 89 Dividends are an Outflow of Cash and also shown as a negative number, but Dividends are never less than zero 90 91 Cash Flow Statement 92 Net Income Accounting 93 + Depreciation 1,500 Accounting 94 - Increase in Accounts Receivable 95 + Increase in Accounts Payable Accounting 96 - Capital Expenditures (CapEx) (800) (1,000) (1,000) Accounting 97 - Dividends Accounting 98 Payout Ratio Business 99 = Increase (Decrease) in Cash 700 Accounting 100 101 102 103 - The company uses 10-year straight line depreciation (10% a year for 10 years beginning year after the investment) Minus the increase in Accounts Receivable (the Accounts Receivable in the current year minus that in the previous year) Increase in Accounts Payable (the Accounts Payable in the current year minus that in the previous year) Dividends is the negative of the Net Income multiplied by Payout Ratio 10
Step by Step Solution
There are 3 Steps involved in it

Get step-by-step solutions from verified subject matter experts