

Question: please anyone can write analysis summary on cash flow statement atleast 600 words. Cash Flow Statement Cash Flow Periodic Ending 5/31/2018 1,933,000 5/31/2017 4,240,000 5/31/2016
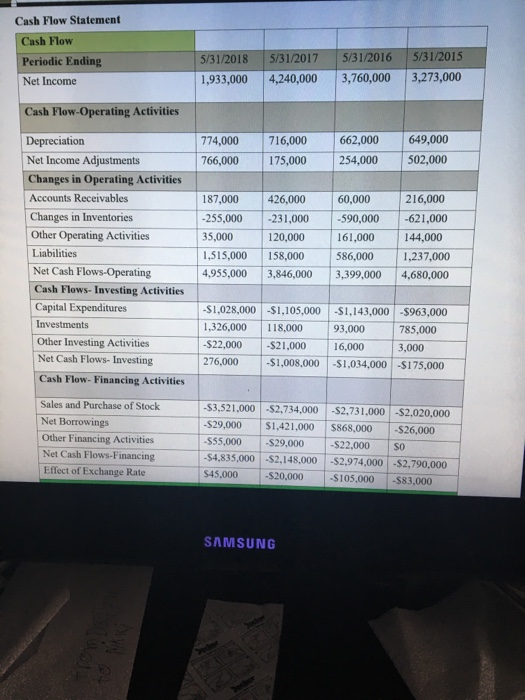
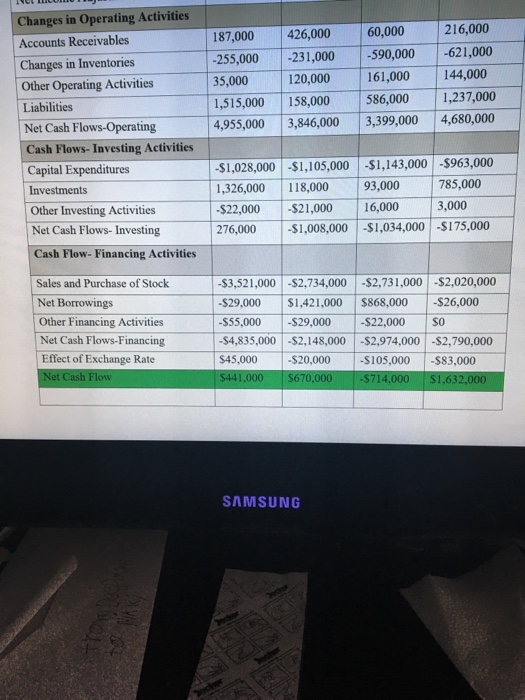
Cash Flow Statement Cash Flow Periodic Ending 5/31/2018 1,933,000 5/31/2017 4,240,000 5/31/2016 3,760,000 5/31/2015 3,273,000 Net Income Cash Flow-Operating Activities 774,000 766,000 716,000 175,000 662,000 254,000 649,000 502,000 Depreciation Net Income Adjustments Changes in Operating Activities Accounts Receivables Changes in Inventories Other Operating Activities Liabilities Net Cash Flows-Operating Cash Flows- Investing Activities Capital Expenditures Investments Other Investing Activities Net Cash Flows- Investing Cash Flow. Financing Activities 187,000 -255,000 35,000 1,515,000 4,955,000 426,000 -231,000 120,000 158,000 3,846,000 60,000 -590,000 161,000 586,000 3,399,000 216,000 -621,000 144,000 1,237,000 4,680,000 -$1,028,000 1,326,000 -$22,000 276,000 $1,105,000 $1,143,000 -5963,000 118,000 93,000 785,000 $21,000 16,000 3,000 -$1,008,000 -51,034,000 -$175,000 $2.020,000 -26,000 Sales and Purchase of Stock Net Borrowings Other Financing Activities Net Cash Flows-Financing Effect of Exchange Rate -$3,521,000 -$29,000 -$55,000 -S4,835,000 S45,000 $2,734,000 $1,421,000 -$29,000 $2,148,000 $20,000 $2,731,000 $868,000 -$22.000 $2,974.000 S105,000 -$2,790,000 $83.000 SAMSUNG 187,000 -255,000 35,000 1,515,000 4,955,000 426,000 -231,000 120,000 158,000 3,846,000 60,000 -590,000 161,000 586,000 3,399,000 216,000 -621,000 144,000 1,237,000 4,680,000 Changes in Operating Activities Accounts Receivables Changes in Inventories Other Operating Activities Liabilities Net Cash Flows-Operating Cash Flows- Investing Activities Capital Expenditures Investments Other Investing Activities Net Cash Flows- Investing Cash Flow- Financing Activities -$1,028,000 1,326,000 -$22,000 276,000 $1,105,000 118,000 -$21,000 -$1,008,000 $1,143,000 93,000 16,000 $1,034,000 $963,000 785,000 3,000 -$175,000 SO Sales and Purchase of Stock Net Borrowings Other Financing Activities Net Cash Flows-Financing Effect of Exchange Rate Net Cash Flow -$3,521,000 -$2,734,000 -$29,000 $1,421,000 -$55,000 -$29,000 -$4,835,000 -$2,148,000 $45,000 $20,000 $441,000 $670,000 $2,731,000 $2,020,000 $868,000 -$26,000 -$22,000 -$2,974,000 -$2,790,000 -S105,000 -$83,000 -$714,000 $1.632,000 SAMSUNG Cash Flow Statement Cash Flow Periodic Ending 5/31/2018 1,933,000 5/31/2017 4,240,000 5/31/2016 3,760,000 5/31/2015 3,273,000 Net Income Cash Flow-Operating Activities 774,000 766,000 716,000 175,000 662,000 254,000 649,000 502,000 Depreciation Net Income Adjustments Changes in Operating Activities Accounts Receivables Changes in Inventories Other Operating Activities Liabilities Net Cash Flows-Operating Cash Flows- Investing Activities Capital Expenditures Investments Other Investing Activities Net Cash Flows- Investing Cash Flow. Financing Activities 187,000 -255,000 35,000 1,515,000 4,955,000 426,000 -231,000 120,000 158,000 3,846,000 60,000 -590,000 161,000 586,000 3,399,000 216,000 -621,000 144,000 1,237,000 4,680,000 -$1,028,000 1,326,000 -$22,000 276,000 $1,105,000 $1,143,000 -5963,000 118,000 93,000 785,000 $21,000 16,000 3,000 -$1,008,000 -51,034,000 -$175,000 $2.020,000 -26,000 Sales and Purchase of Stock Net Borrowings Other Financing Activities Net Cash Flows-Financing Effect of Exchange Rate -$3,521,000 -$29,000 -$55,000 -S4,835,000 S45,000 $2,734,000 $1,421,000 -$29,000 $2,148,000 $20,000 $2,731,000 $868,000 -$22.000 $2,974.000 S105,000 -$2,790,000 $83.000 SAMSUNG 187,000 -255,000 35,000 1,515,000 4,955,000 426,000 -231,000 120,000 158,000 3,846,000 60,000 -590,000 161,000 586,000 3,399,000 216,000 -621,000 144,000 1,237,000 4,680,000 Changes in Operating Activities Accounts Receivables Changes in Inventories Other Operating Activities Liabilities Net Cash Flows-Operating Cash Flows- Investing Activities Capital Expenditures Investments Other Investing Activities Net Cash Flows- Investing Cash Flow- Financing Activities -$1,028,000 1,326,000 -$22,000 276,000 $1,105,000 118,000 -$21,000 -$1,008,000 $1,143,000 93,000 16,000 $1,034,000 $963,000 785,000 3,000 -$175,000 SO Sales and Purchase of Stock Net Borrowings Other Financing Activities Net Cash Flows-Financing Effect of Exchange Rate Net Cash Flow -$3,521,000 -$2,734,000 -$29,000 $1,421,000 -$55,000 -$29,000 -$4,835,000 -$2,148,000 $45,000 $20,000 $441,000 $670,000 $2,731,000 $2,020,000 $868,000 -$26,000 -$22,000 -$2,974,000 -$2,790,000 -S105,000 -$83,000 -$714,000 $1.632,000 SAMSUNG
Step by Step Solution
There are 3 Steps involved in it

Get step-by-step solutions from verified subject matter experts