

Question: Please ask, sir question below Listed below are annual data for various years. The data are the numbers of cars sold (thousands) and the numbers
Please ask, sir question below
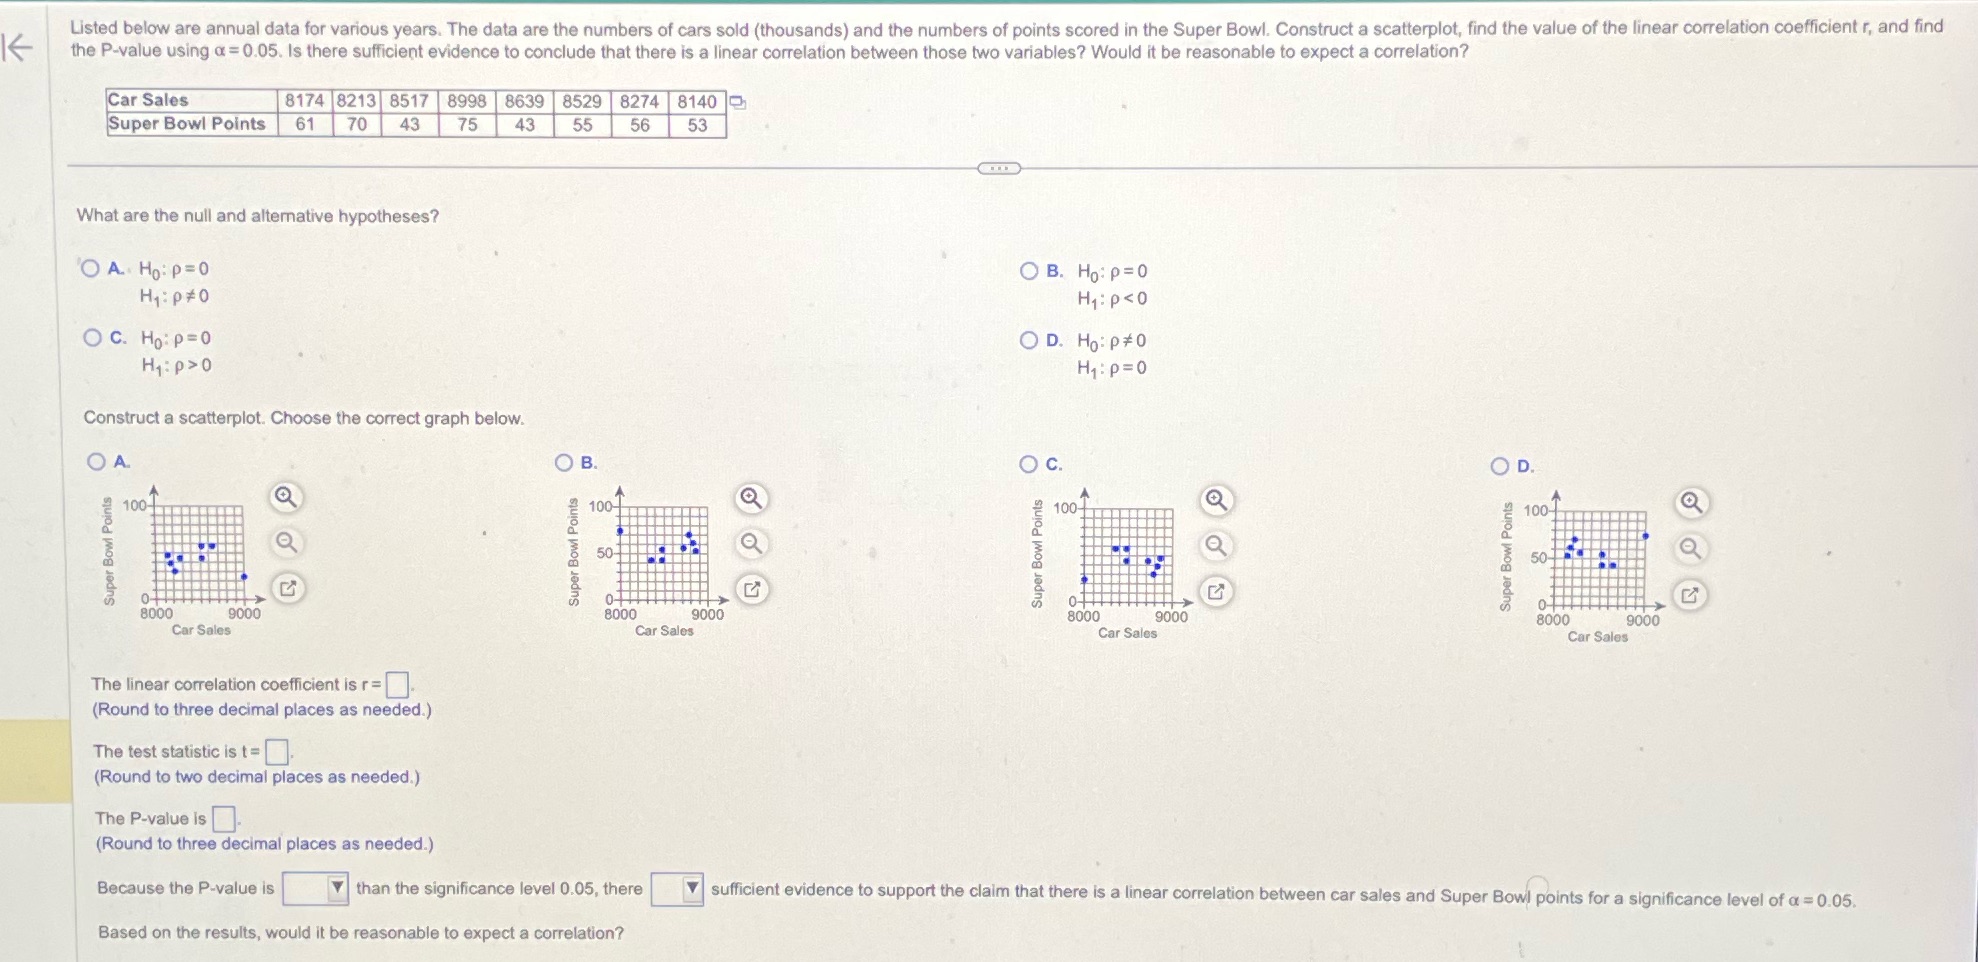
Listed below are annual data for various years. The data are the numbers of cars sold (thousands) and the numbers of points scored in the Super Bowl. Construct a scatterplot, find the value of the linear correlation coefficient r, and find the P-value using a = 0.05. Is there sufficient evidence to conclude that there is a linear correlation between those two variables? Would it be reasonable to expect a correlation? Car Sales 8174 8213 8517 8998 8639 8529 8274 8140 Super Bowl Points 61 70 43 75 43 55 56 53 What are the null and alternative hypotheses? O A Ho: P= 0 OB. Ho: P= 0 H1: P #0 H1 : P o H1 : P=0 Construct a scatterplot. Choose the correct graph below. O A. O B. O c. OD. 100- A 100- 100 100- Super Bowl Points 50- Q Super Bowl Points Super Bowl Points Super Bowl Points OHHHH 8000 9000 8000 9000 8000 9000 8000 9000 Car Sales Car Sales Car Sales Car Sales The linear correlation coefficient is r =]. (Round to three decimal places as needed.) The test statistic is t =]. (Round to two decimal places as needed.) The P-value is. (Round to three decimal places as needed.) Because the P-value is than the significance level 0.05, there sufficient evidence to support the claim that there is a linear correlation between car sales and Super Bowl points for a significance level of a = 0.05. Based on the results, would it be reasonable to expect a correlation
Step by Step Solution
There are 3 Steps involved in it

Get step-by-step solutions from verified subject matter experts